Tracking Events is a very useful way to measure interactions your users make with your website content, which is not directly page views or downloads. Typically events are used to track clicks on elements in your pages such as menu, widgets, Flash elements, AJAX actions, or even actions within games or media content.
Anatomy of Events
An Event has four components. These values are displayed in your Site Analytics reports:
- Category
- Event
- Tag
- Value (optional)
Event JavaScript API Syntax:
| _paq.push([‘trackEvent’, ‘Category’, ‘Event’, ‘Tag’, ‘Value’]) |
For example:
To track a click on the Play button of the Documentary “Thrive” you may write in your FH Tracking Code in your pages or Tag Manager:
| _paq.push([‘trackEvent’, ‘Documentary’, ‘Play’, ‘Thrive’]); |
To track the progress of playing a particular movie, for example when 20% of the movie has been played already:
| _paq.push([‘trackEvent’, ‘Documentary’, ‘Play-20%’, ‘Thrive’]); |
You may also track numeric values for your event. Event value is often used to track ratings and scores of particular items, such as tracking a rating of 9.5 out of 10 for Thrive:
| _paq.push([‘trackEvent’, ‘Documentary’, ‘Rating’, ‘Thrive’, 9.5]); |
FH reports for events will include the Total Event value, the Average event value as well as the Minimum and Maximum value, for each Event Category and each Event Name and each Event Action.
If you want to assign custom data to the event, you can do so by passing it as a dimension.
Event JavaScript API Syntax with Dimension:
| _paq.push([‘trackEvent’, ‘Category’, ‘Event’, ‘Tag’, ‘Value’,{dimension6:’value’,dimension7:’value’,dimension8:’value’,dimension9:’value’,dimension10:’value’,}]) |
What is a Dimension?
With Custom Dimensions you can assign any custom data to your visitors or actions (like pages, events, …) and then visualize the reports of how many visits, conversions, pageviews, etc., there were for each Custom Dimension.
Viewing Event Report
In order to View Event Report:
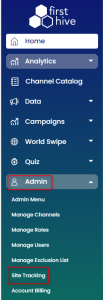
- Login to FirstHive.
- In left panel click on Admin >> Site Tracking
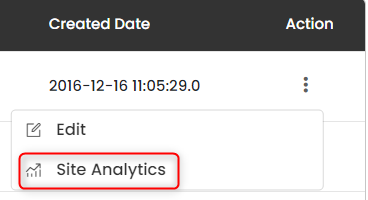
- Click three vertical dots
 under action >> Site Analytics.
- On Site Analytics Dashboard, click Behavior and then Events.
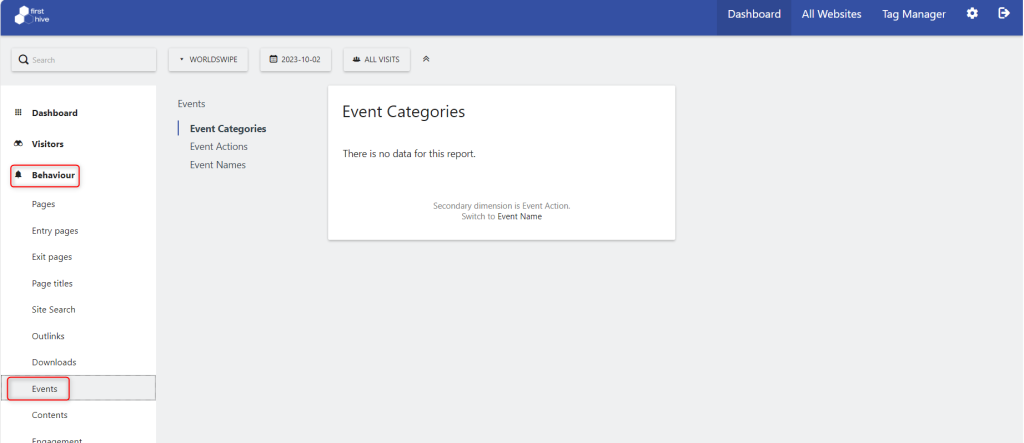
You can also change the visualization >> click Change Visualization icon.
![]()
Other Interactions
Events are used to track interactions which are not page views. You can track all kinds of interactions with Events, but in some cases, we have created specific and better ways to measure specific interactions, Learn more