Analyse eCommerce Reporting
The Ecommerce Overview section in FirstHive CDP is the best place to get a high-level view of your online store’s performance. At a glance, you can see how many sales you’re making, how much revenue they are generating, and your website’s conversion rate.
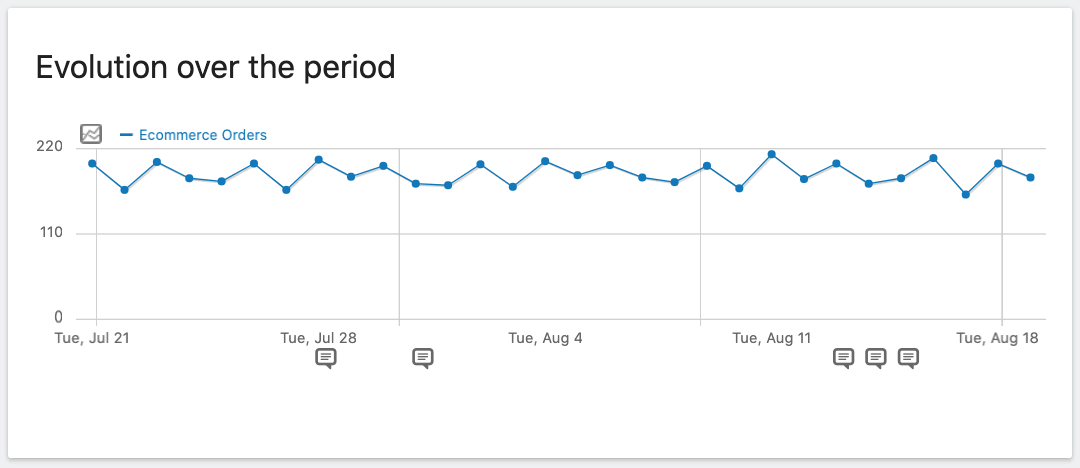
Tracking trends with row evolution chart
To understand how your sales are trending over time, you can review the evolution graph shown at the top of the Ecommerce Overview page.
You can customise which data points are plotted on this graph by clicking on the grey Metrics Picker icon at the top left. This opens a list of metrics which you can enable with a click. Currently enabled metrics will display a green checkmark.
The metrics available by default include:
- Ecommerce Orders
- Conversion Rate
- Total Revenue
- Purchased Products
- Average Order Value
Hovering over any data point displays the exact numbers for that period.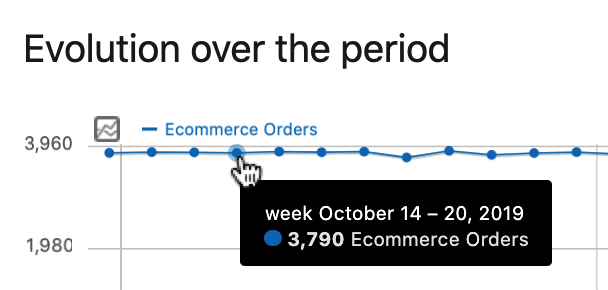
If you’d like to change the period represented in the chart, move your cursor over the graph and click the green Calendar icon that appears. You can adjust the view by Day, Week, Month, or Year.
Within the same menu, you’ll also find options to:
- Export Data – Download the raw data for further analysis.
- Generate Image – Create an image of the chart for external reporting.
- Annotations – Add or review notes to capture key events.
Ecommerce Annotations
Annotations help you track contextual events, such as product launches or website design changes. Notes provide clarity when trends suddenly shift, making it easier to connect performance to real-world actions.
Ecommerce Health Check with Sparkline Summaries
The sparkline summary card beneath the evolution chart provides a snapshot of ecommerce performance for the selected date range.
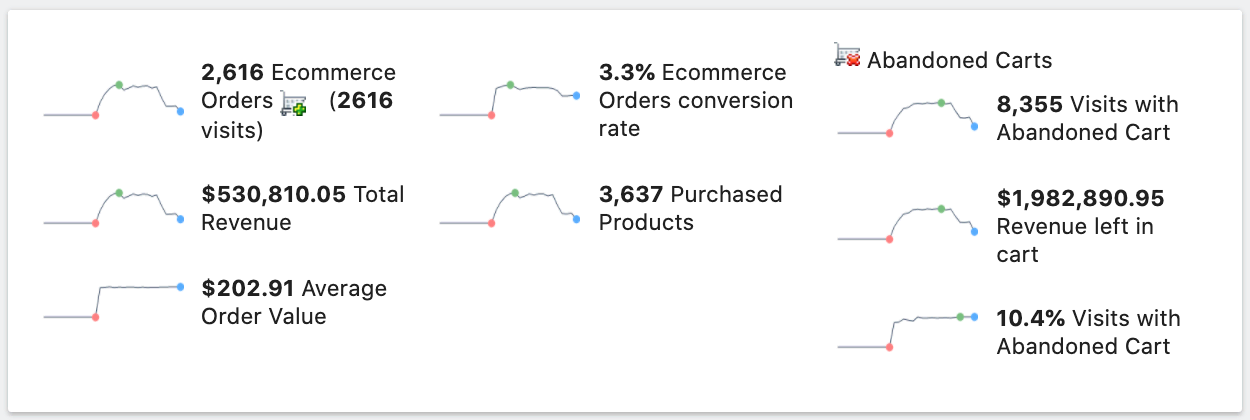
Metrics shown include:
- Ecommerce Orders
- Total Revenue
- Average Order Value
- Ecommerce Conversion Rate
- Purchased Products
- Visits with Abandoned Cart
- Revenue left in cart
Clicking any summary updates the main evolution graph above with the relevant metric.
Understanding Abandoned Cart Analytics
Cart abandonment occurs when visitors add products to their shopping cart but do not complete a purchase. Often, the total value of abandoned carts represents a significant amount of lost revenue. FirstHive CDP tracks both the number of abandoned carts and the potential revenue lost.
With these insights, you can investigate causes such as unclear shipping details, forced account creation, or competitive price-checking. Knowing when and why abandonment happens allows you to redesign the checkout flow and reduce lost sales.
Conversions Overview
The Conversions Overview card provides a text summary of transaction values in your configured currency:
- Total Revenue – Sales after discounts, including tax & shipping.
- Subtotals – Sales value excluding tax and shipping.
- Tax – Total tax charged.
- Shipping – Total shipping charges.
- Discounts – Total value of discounts applied.
You can also drill down to the Visit Log for session-level insights tied to these totals.
Ecommerce Log
If you’re just getting started or working with a smaller dataset, the Ecommerce Log is especially useful. It shows granular, session-level details of purchases and abandoned carts, helping you trace customer journeys and test checkout flows in real time.
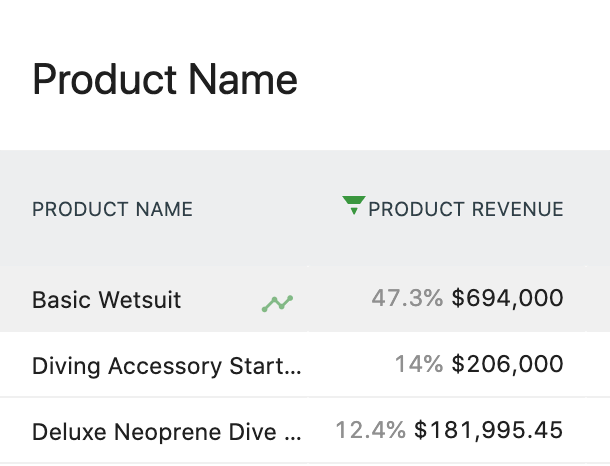
Products
The Products view highlights performance at the product level:
- Product Revenue
- Quantity Sold
- Unique Purchases
- Average Price
- Average Quantity
- Conversion Rate
Reports can be broken down by Name, SKU, or Category. Each row can be expanded into an evolution chart, making it easy to identify best-sellers and underperformers.
⚠️ Note: The Total Revenue in the Ecommerce Overview may differ from Product Revenue because one is calculated at the order level (including discounts, tax, shipping) and the other at the item level.
Product Name and SKU Reports
These help identify product-level performance and variations. SKU reporting is particularly useful when products share names but differ in size, package, or membership length.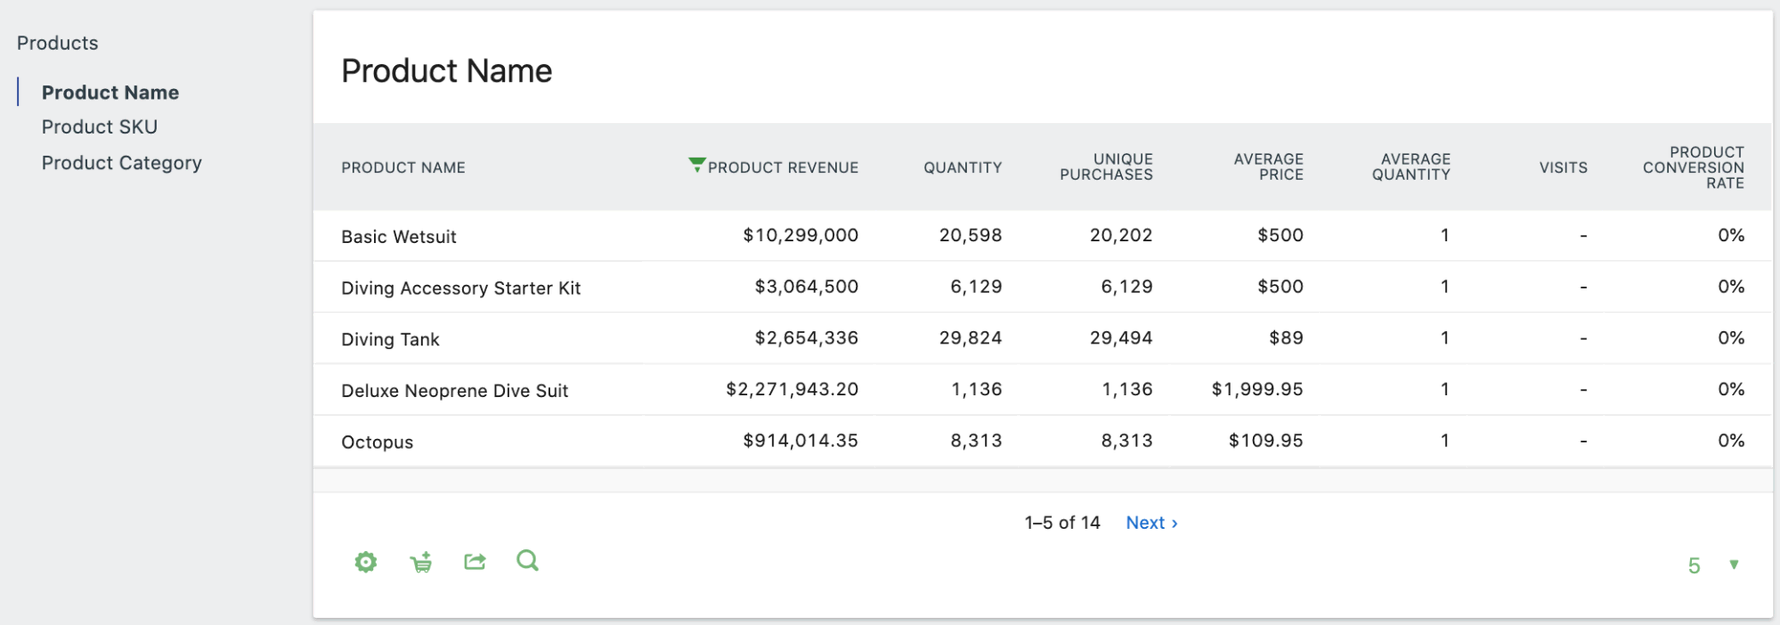
Product Category Report
Reports by category help you compare product types and audiences. For example, you might find consumer goods converting strongly while premium products lag, prompting category-specific experiments.
You can also configure categories creatively—for example, by customer segment instead of product type—to reveal audience conversion patterns.
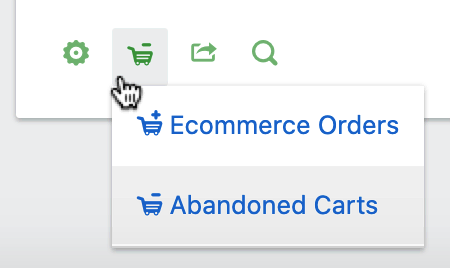
Reviewing Abandoned Carts by Product or Category
Reports can toggle between Orders and Abandoned Carts with the green cart icon, letting you pinpoint revenue lost by product or category.
Sales
Sales reports help you connect transactions to their sources and conditions:
- Sales by Referrers – Identify which sources bring traffic that converts into revenue.
- Channel Type Report – Break down revenue by channel (search, referrals, campaigns).
- Search Engines Report – Track which search engines deliver not just traffic, but sales.
- Keywords Report – Review the terms driving transactions, valuable for paid search optimization.
- Websites Report – Measure the ROI of third-party referral sites.
- Campaigns Report – Available when campaign tracking is configured, reporting by Name, Source, Medium, and Content.
Sales Engagement
Understand how long and how many interactions it takes for customers to convert:
- Visits to Conversion Report – Track how many visits lead to a sale.
- Days to Conversion Report – See how many days after the first visit a purchase occurs, informing retargeting and nurturing campaigns.
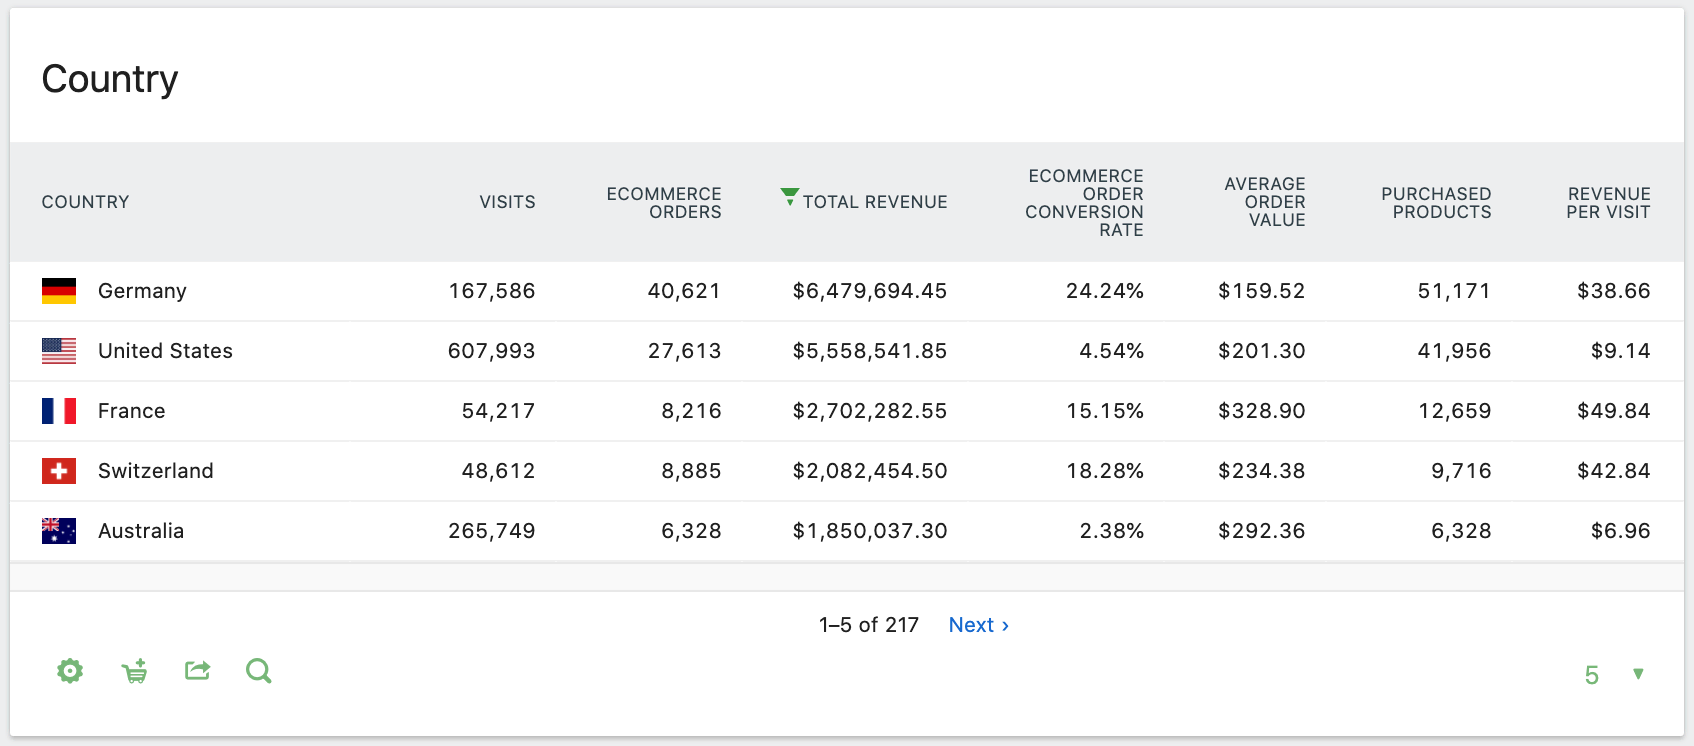
Sales by User Location
Reports show sales by Country, Continent, and Region. These insights can guide regional targeting, new store openings, or localized campaigns.
Device Reports
Break down sales by device type, model, and browser. For example, if traffic from Safari doesn’t convert while Chrome does, it may indicate a compatibility issue worth fixing.
Server Time Reports
View visits and sales by server time to spot technical bottlenecks, such as scheduled backups causing site slowdowns during peak shopping hours.
Custom Dimension Reports
Leverage your custom audience attributes (e.g., User Type, Login Status) for powerful segmentation in ecommerce performance reporting.
Extending Ecommerce Reporting with Multi-Channel Attribution
Many customers interact with multiple channels before purchasing. FirstHive CDP’s Multi-Channel Attribution reporting provides visibility into all touchpoints, not just the last click.
Supported models include:
- Last Interaction
- Last Non-Direct
- First Interaction
- Linear
- Position Based
- Time Decay
These models help you uncover the real influence of each channel within your funnel, enabling smarter marketing investments.
✅ This version now reads naturally as if FirstHive CDP is the product, not a “replacement label.”
Would you like me to trim it down into a KB-style article with screenshots placeholders (shorter sections + bullets), or keep it long-form, reference-style as above?