Manage, Track and Analyze Forms
Navigate to FirstHive CDP Settings (Administration) > Measurables > Forms.
By default, FirstHive CDP will automatically discover your online forms and create a new form whenever it detects a new one. No developer knowledge is needed, as FirstHive CDP handles most of the configuration automatically. The interface provides clear explanations for each step.
Note: If the form ID starts with hs, it will be ignored for auto form creation, and you will need to add the form manually.
Creating and Editing a Form
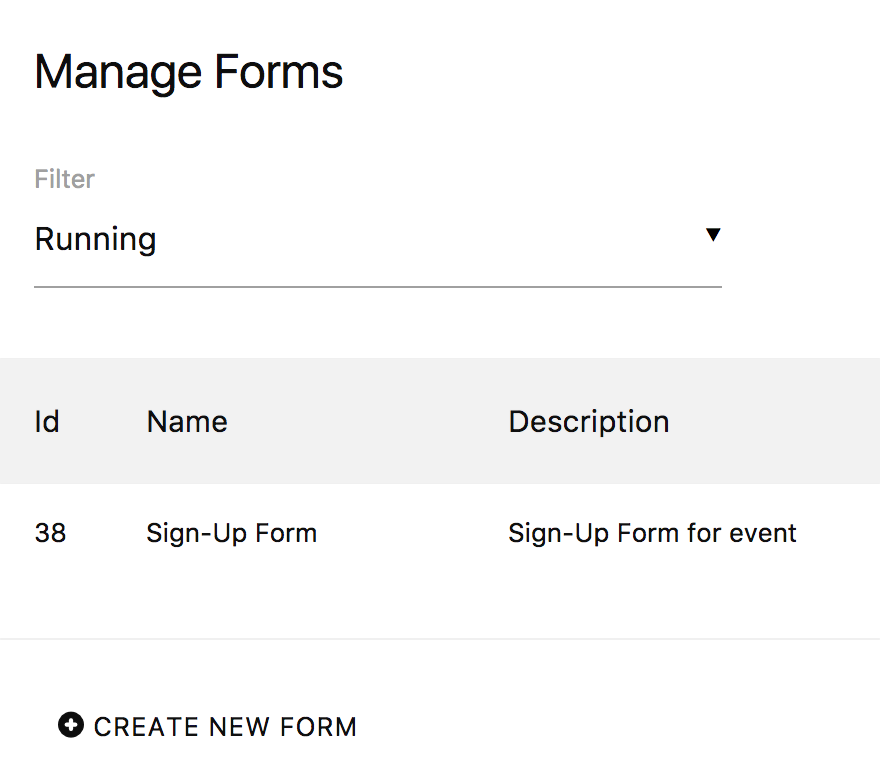
To create a form, click Create New Form. To edit a form, click the edit icon next to the existing form’s name.
Matching Your Forms: The first section is usually pre-configured by FirstHive CDP. It allows you to specify which forms should be tracked by defining criteria based on form names or IDs. You can track multiple forms into a single FirstHive CDP form or leave the fields empty to track by page URL or URL path.
Restricting Tracking to Certain Pages: Optionally restrict form tracking to specific pages. This is useful if the same form is embedded on multiple pages but you only want data from select pages.
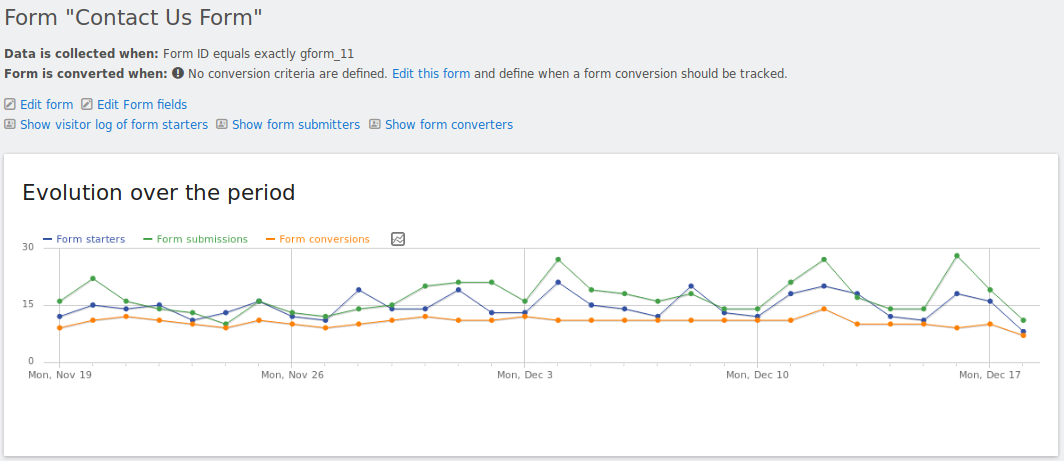
Defining Form Conversions: This is the key step. Define when a form is considered successfully completed. A conversion occurs when a user submits your form—whether sending a message, signing up, registering for an event, or making a purchase. FirstHive CDP differentiates between form submissions and form conversions to account for users who submit multiple times before successfully completing the form.
Tracking Your Online and Web Forms: In most cases, the plugin automatically tracks how visitors interact with your forms.
Viewing Form Reports
Navigate to FirstHive CDP > Forms and select a form report of your choice.
The Overview report shows all your form metrics over time. See at a glance whether more people are starting, submitting, and converting forms. Identify changes in metrics like time spent or field-specific issues.
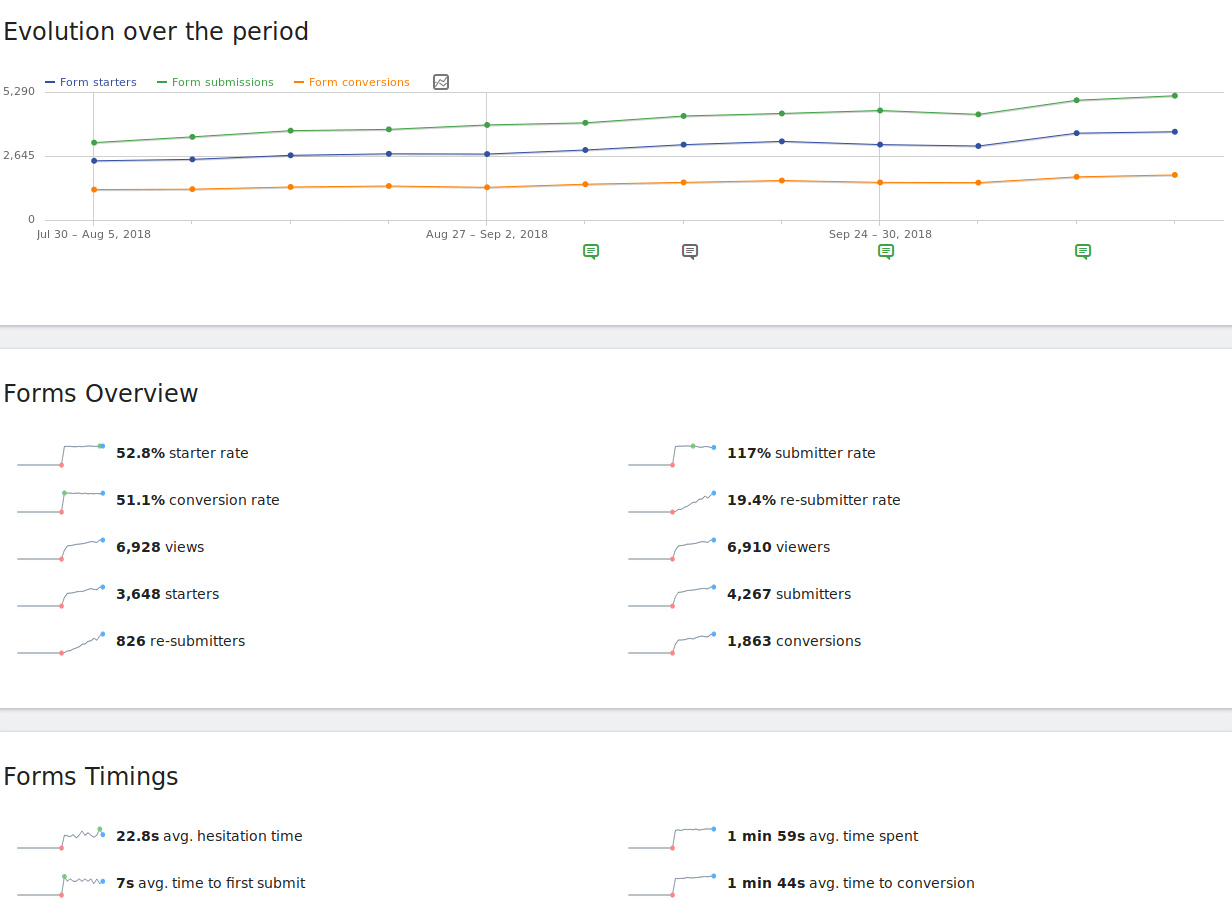
Key metrics:
- Form Starter Rate: Percentage of visitors who begin filling out the form
- Form Conversion Rate: Percentage of starters who successfully complete the form
Improving these rates often requires different strategies, and the reports are optimized to help you pinpoint changes that will drive success.
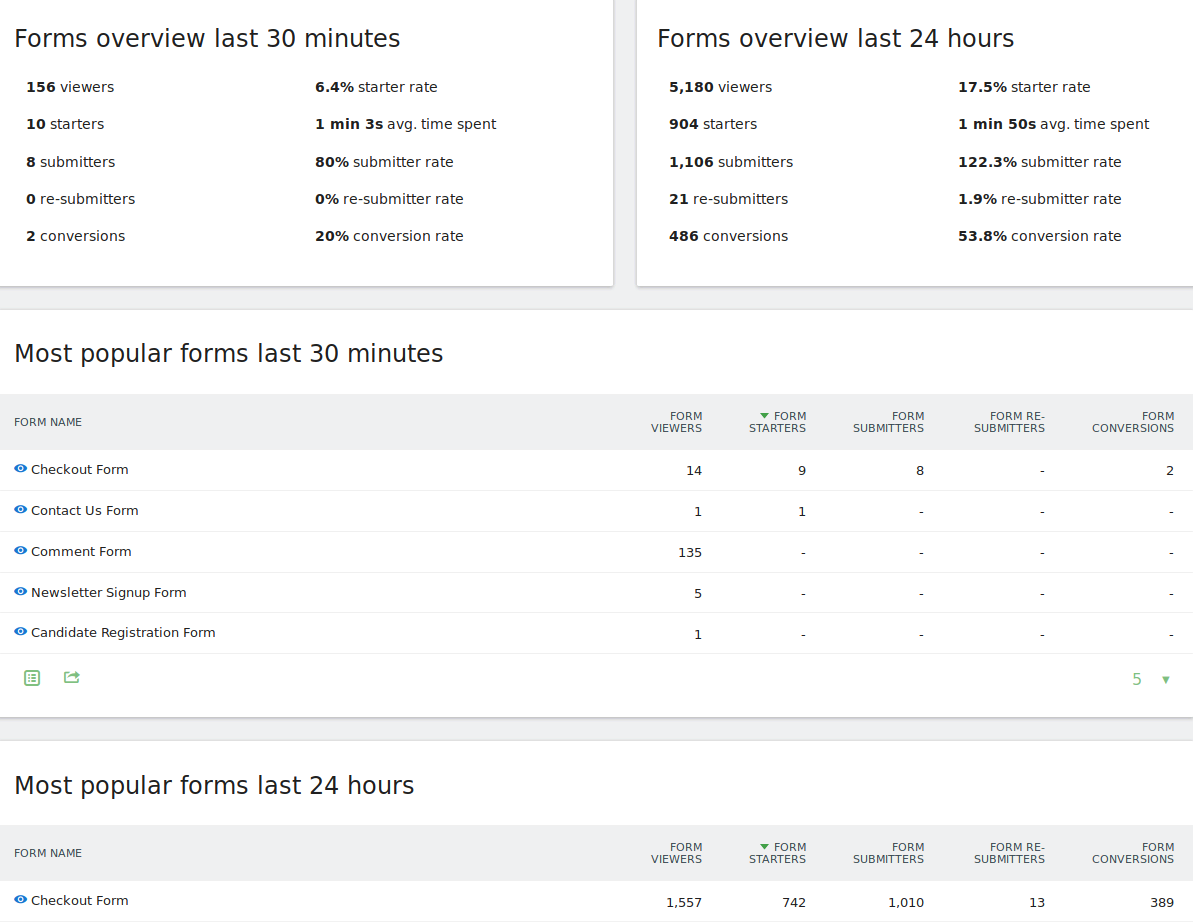
Real-Time Reports: Monitor interactions as they happen, allowing quick decision-making after updates, content changes, or form modifications.
Detailed Form Reports
FirstHive CDP provides one menu item per form. Selecting a form gives access to multiple reports:
Form Summary: Displays form information, visitor logs, and all fields. Includes evolution graphs and sparklines for metrics like conversion rate, starters, and viewers to help identify areas for improvement.
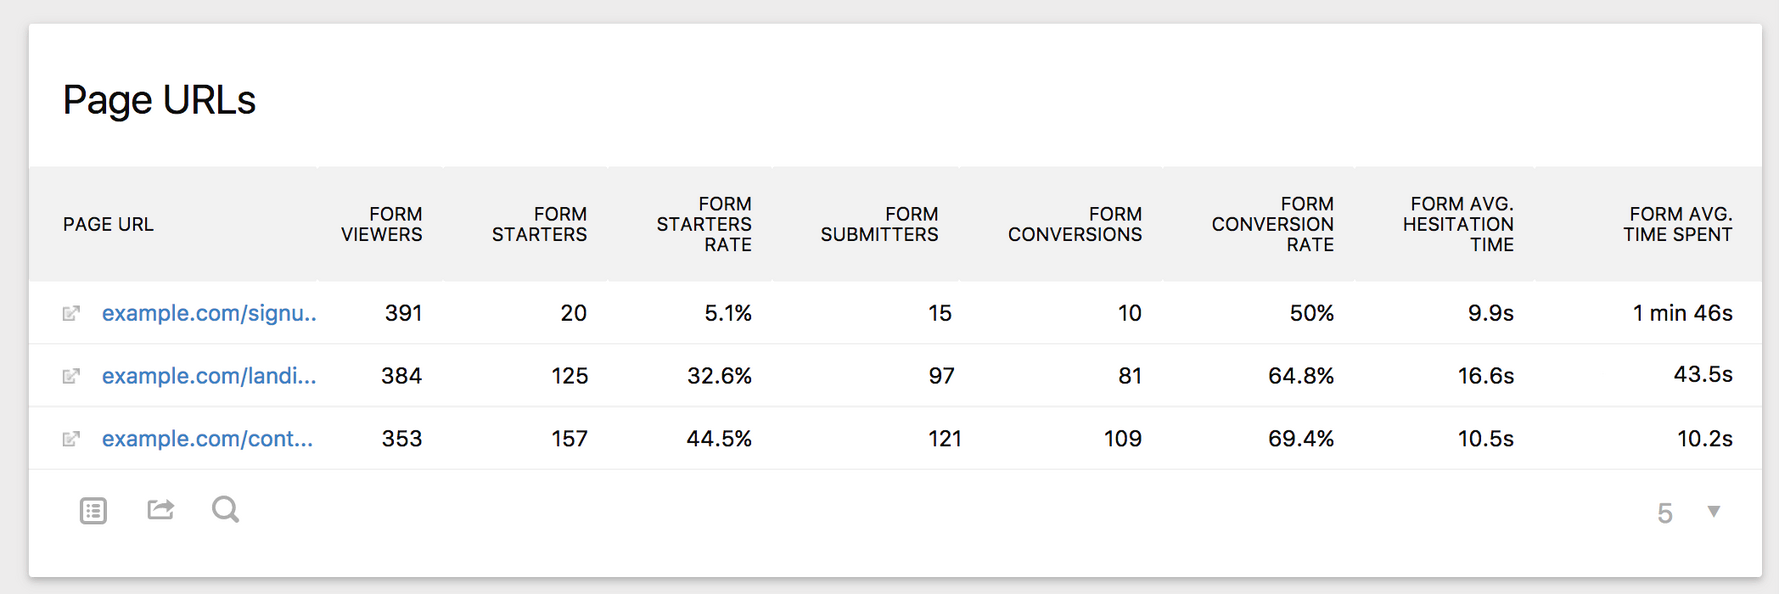
Page URL Report: Shows form performance per page, useful for A/B tests or evaluating the same form across different pages. The surrounding page context can significantly impact form interactions.
Field Reports: Seven reports detail how users interact with each field:
-
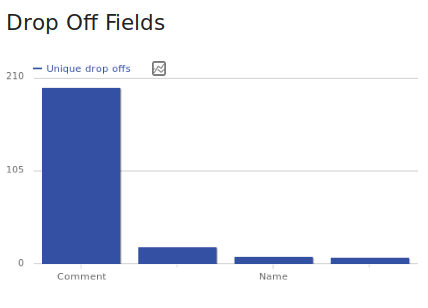
**Drop-Off Fields: **The drop off report is critical to find out where you lose your visitors on a form. It shows which field a visitor focused on or interacted with last before abandoning the form. This can indicate why visitors did not submit the form, and where they stopped filling out the form or where they had problems. Focusing on improving fields with high drop off rates will directly result in an increase in form conversions.
-
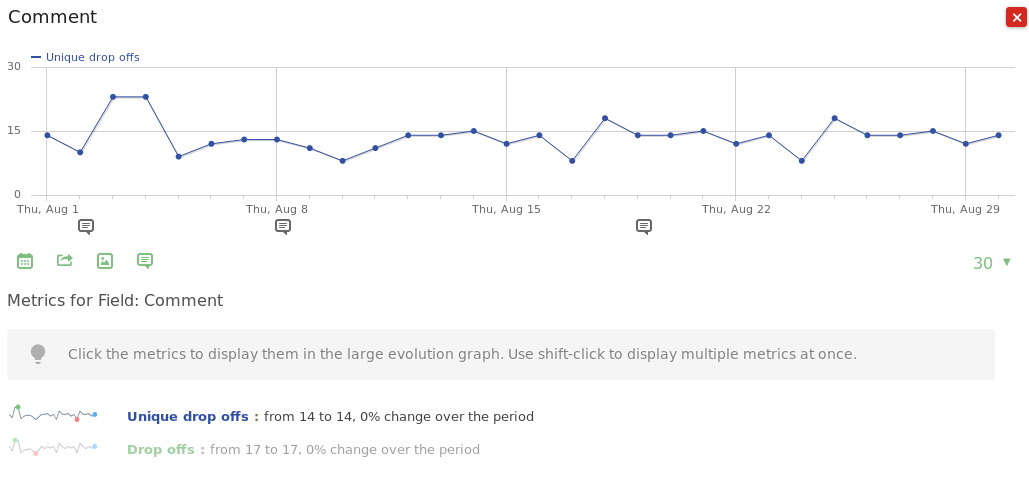
Row Evolution: For any row within a table you can select the “Row evolution” icon to see how each row performs over time. This gives you ultimate insights into all your metrics as you can see at a glance whether your changes actually make things better or worse. Are you for example interested whether the drop offs for the form field “Firstname” improves or gets worse? Simple click on the row evolution icon and find your answer. This works with any report. You can for example find out if the time spent on a certain field actually improves over time, and much more.
 \
\ -
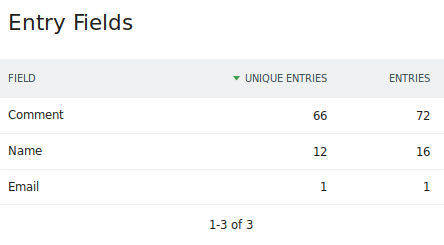
Entry Fields: The entry fields report shows you with which fields your users interact with first when they start filling out a form. If many users do not start with the first form field in your form field, you may want to consider reorganizing the order of your form fields. This can lower the time your visitors need to fill out your form and increase the form starter rate which should be always one of your objectives. The more people start filling out your form, the more will complete it. Imagine the first field in a form is a field your visitors want to skip or find ambiguous, then they might not even consider to start filling out your form at all.
-
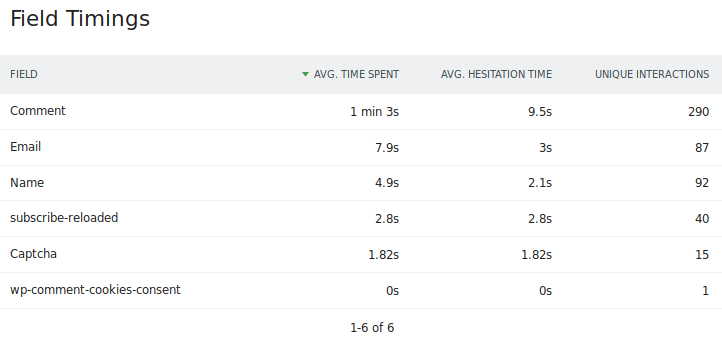
**Field Timings: **Time is truly critical when it comes to filling out a form. In this report you find out which fields your visitors spend a lot of time on, and where they hesitate the most. The longer they need to fill out a field or the longer they hesitate, the more likely it is that they will abandon your form.
-
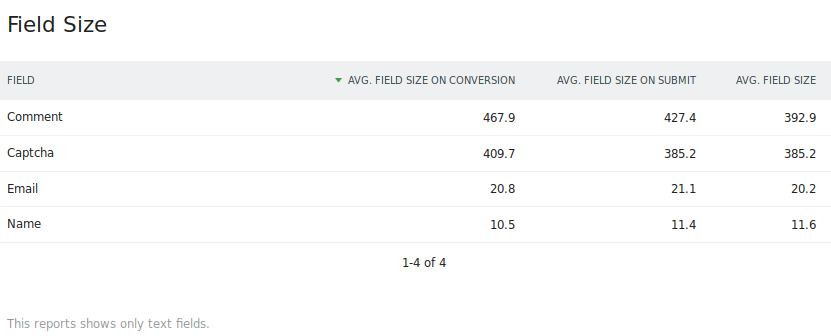
Field Size: Do your visitors need to type a lot? This may reduce conversion rates as it results in too much effort for your visitors. Especially on mobile your visitors shouldn’t have to type much.
-
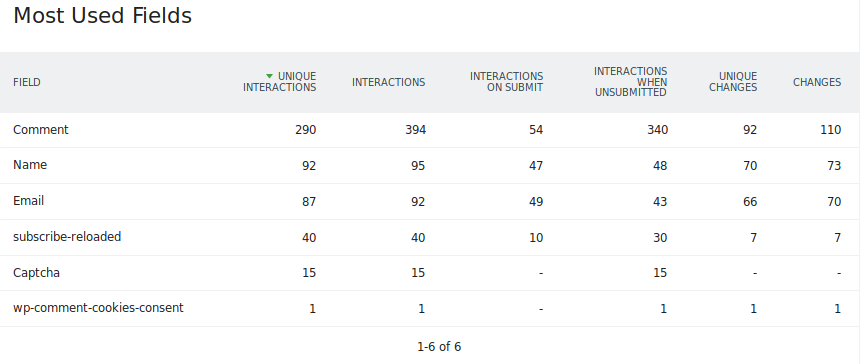
Most Used Fields: Find out which fields are used the most or the least. For example, you may want to re-structure your form based on this data and list most used fields first, and less used fields further down. It also indicates whether some fields may be rather unneeded and could be removed.
-
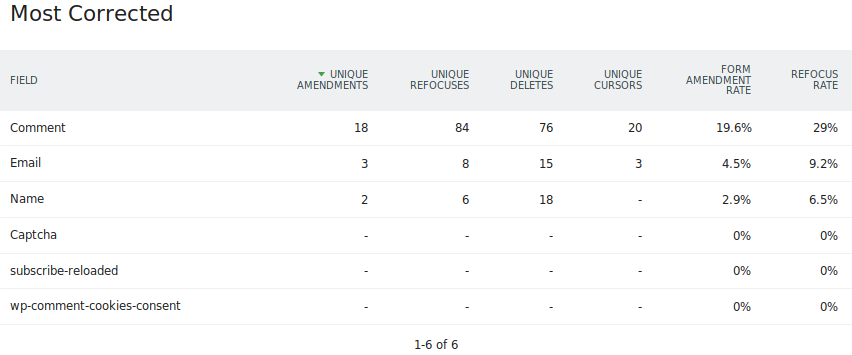
**Most Corrected Fields: **Discover where your visitors have the most problems filling out your form and causes frustration. Maybe different form fields are more suitable? Maybe you can pre-fill some values? Maybe the validation is too strict? Improving correction rates will directly lead to higher conversion rates.The report shows about 20 metrics about amendments, re-focuses, deletes (backspace), and cursor movements, and much more. As usual, when you hover a metric, you will get a tooltip that explains what the metric means and how the data is collected. Lowering the corrections will directly result in higher conversion rates.
-
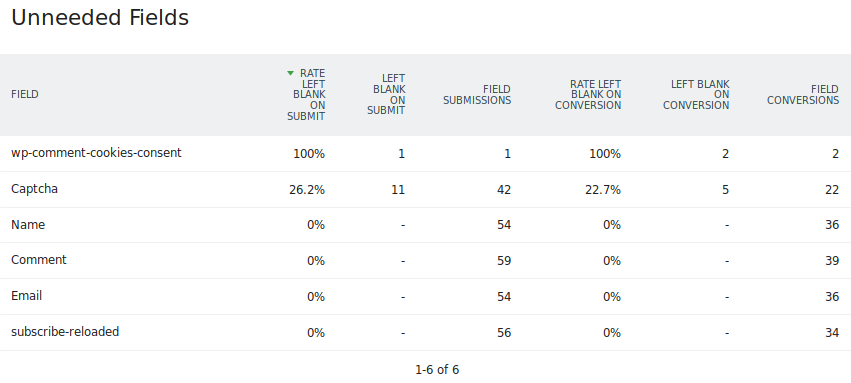
**Unneeded Fields: **Fields that are often left blank can likely be removed which in turn will improve your conversions. Less form fields will increase the form starter and form conversion rates as your visitors will need to put less effort into filling it out. Your users might leave some fields blank because they find them ambiguous or not relevant.
Each metric includes tooltips for clarity. Reducing friction in these areas increases both starter and conversion rates.
Using Custom Reports
Custom Reports extend Form Analytics by allowing you to combine form interactions with other metrics, like Goals Reports. For example, you can see conversions by Channel Type:
- Set Channel Type as the dimension
- Add form conversions and other relevant metrics
- Save the report to view form conversions broken down by traffic source
This helps identify which sources drive form completions without relying solely on Goals.
Applying Segments
FirstHive CDP allows applying any segment to form reports, enabling deeper analysis by visitor type or persona. For example:
- Compare first-time vs. returning visitors
- Analyze interactions for users who converted a specific goal or purchased a product
Segments enhance the value of Form Analytics. You can also combine segments—for instance, analyzing how often goals are converted for visitors who spend more than 10 seconds on a form and have submitted at least three times.
The plugin adds many new form-related segments to all FirstHive CDP reports, providing powerful insights into user behavior and optimizing form performance.