Page Overlay
Page Overlay shows analytics data directly on your website.
By visualizing this data on your actual pages, it brings you closer to the experience of your visitors and helps you understand traffic patterns more effectively.
Using the Page Overlay Feature
Page Overlay displays analytics data directly on your website, letting you see how visitors interact with your pages in real-time.
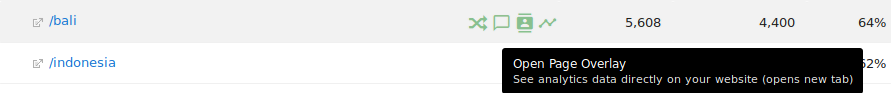
How to Open Page Overlay for a Page
In FirstHive CDP, Page Overlay can be launched from the rows of the Behaviour > Pages reports. Hover over the page you want to inspect and click the bubble icon. Page Overlay will open in a new tab.
Understanding the User Interface
Page Overlay displays your actual website and places bubbles next to links showing how many visitors clicked each link.

Next to your website, a sidebar provides additional data and actions:
- Date Range: Select the date range for which Page Overlay shows statistics. Shortcuts make it faster than using a full date selector. By default, the range is “Current Month.”
- Page Location: Shows the URL of the page you are viewing, matching the page report. Ignored parameters are excluded.
- Main Metrics: Displays the data you would see in the corresponding row of the pages report.
- Row Actions: At the bottom, you can access Row Evolution and Transitions reports.
Click links inside your website, and Page Overlay updates the sidebar with analytics data for each page you visit (as long as it has the FirstHive CDP tracker). This works not only for internal links but also for downloads and outbound links.
Hovering over a link shows the target URL in the lower right, the absolute number of clicks, and how many links point to the same location. For example: “3451 clicks from one of 2 links”.
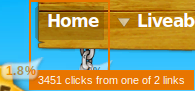
This means two links lead to the same URL, which was visited 3451 times directly after viewing the current page. Page Overlay cannot determine which exact link was clicked, so it displays how many links point to that location and highlights related bubbles when hovering.
FirstHive CDP Page Overlay lets you see how links perform directly on your website. This visualization provides insight into which areas of your site perform better or worse.
Together with the Transitions report, it helps you understand visitor paths, bringing you closer to your audience and inspiring improvements to your content and navigation.