Analyze User ID Reports
You can access the User IDs report within the Visitors section of the main navigation in FirstHive CDP. This report displays a table of all registered User IDs that have interacted with your site during the selected reporting period. It also shows the number of visits and actions completed by each user, along with whether the user converted at least one goal.
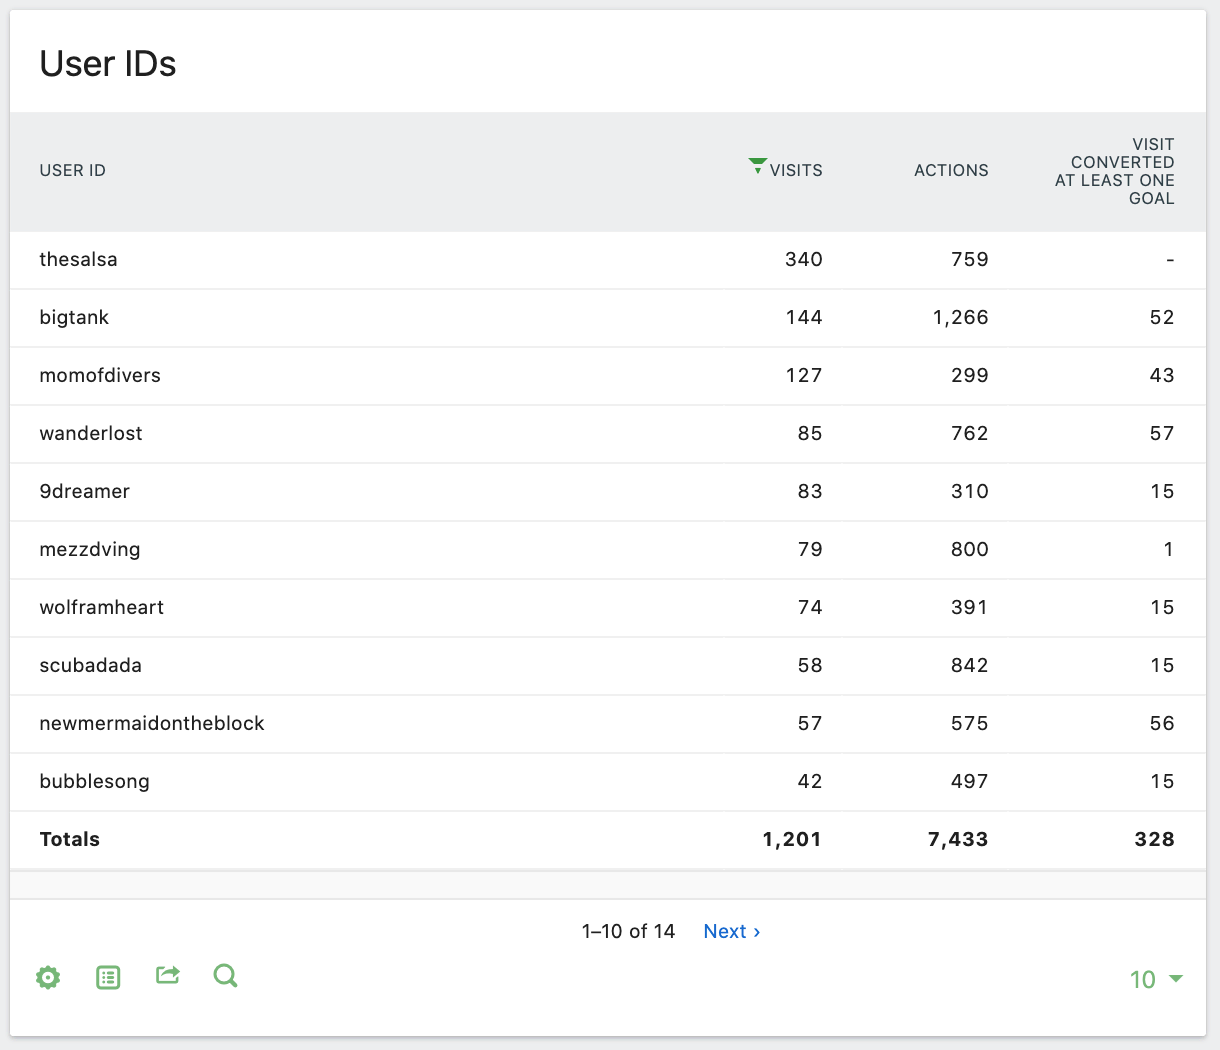
User IDs Table
The User IDs table can also be updated to include more engagement metrics. To do this, hover your mouse over the table so the icons menu appears in the bottom left. Then click on the table icon to reveal the alternative visualisation options. Next, select Display a table with Visitor engagement metrics.
The report will update to include additional columns, allowing you to analyse the following metrics in one view:
- Visits – Number of times each user visited your site during the reporting period.
- Actions – Total number of actions they took on your site (page views, searches, downloads, or external link clicks).
- Actions Per Visit – Average number of actions per visit.
- Avg Time on Website – The average time the user spent per unique visit.
- Bounce Rate – Percentage of visits where only one page was viewed.
- Conversion Rate – Percentage of visits where a Goal was completed.
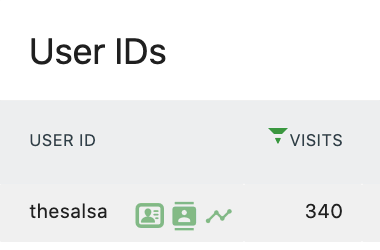
These statistics are helpful for analysing user groups, but you can also get more granular data for individual users. Hover over any User ID row, and you’ll see three green icons appear. Clicking these will let you dig deeper into that user’s visits.
User ID Row Options
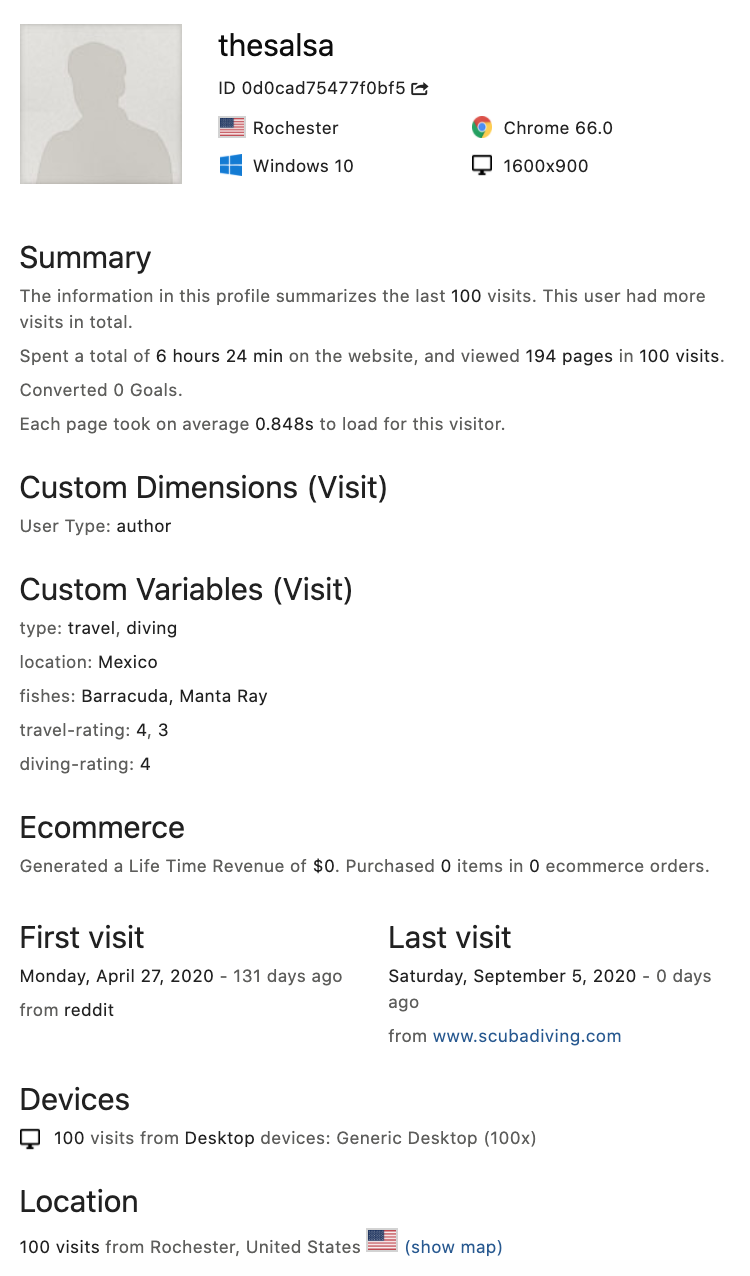
View Visitor Profile
Click the user profile icon to load a Visitor Profile, which provides extended details such as location, device/browser usage, number of visits, custom dimensions, Ecommerce value, and a full breakdown of site interactions. This helps build detailed customer profiles and identify areas where you can deliver more value.
Open Segmented Visits Log
Click the segmented visits log icon to view a paginated log of all visits linked to the User ID. User IDs stored without pseudonyms are particularly useful for customer support teams to debug where a specific user may be experiencing issues.
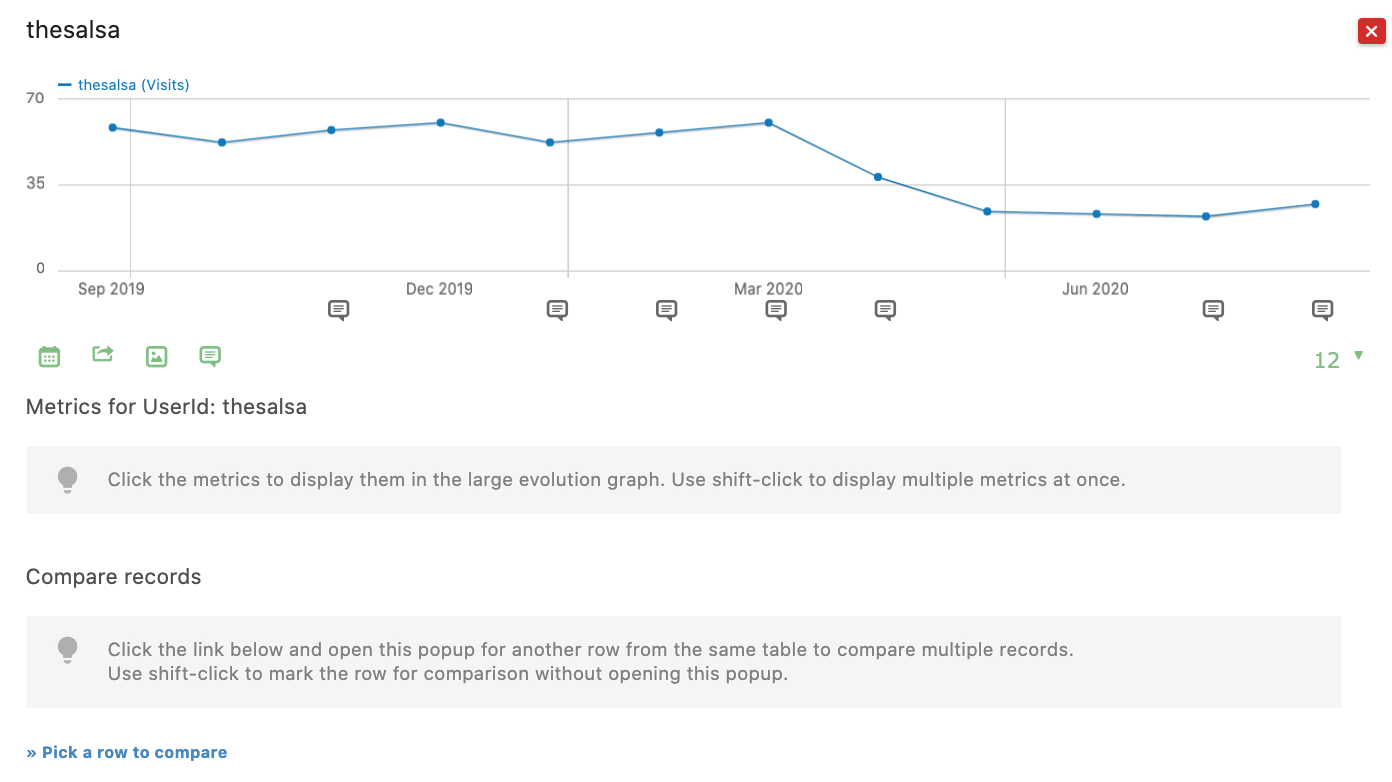
Open Row Evolution
Click the row evolution icon to load an Evolution Graph, where you can track engagement trends for that user over time. This view helps identify patterns and potential issues — for example, dips in engagement that align with recent website changes.
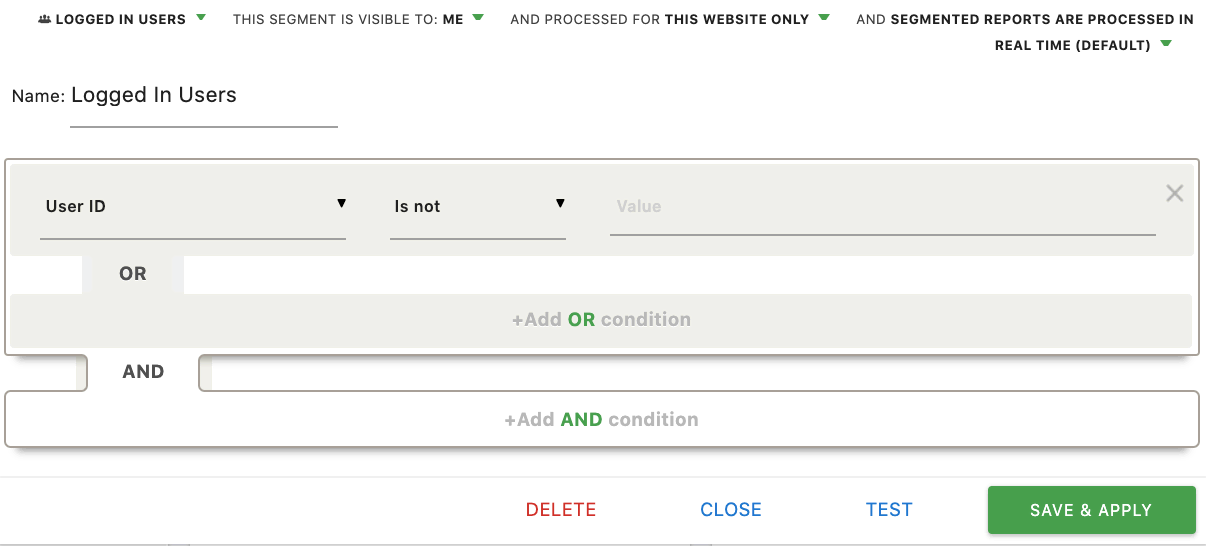
Using User IDs to Create a “Logged In” Segment
Segments let you analyse groups of visitors based on specific criteria. Paired with the User ID feature, you can create a segment specifically for logged-in users. The key step is to assign User IDs only to registered and logged-in visitors. From there, use the segment builder to check for the presence of a User ID, which signals a logged-in visitor.
This segment helps you:
- Compare logged-in users with logged-out users.
- Understand how your most valuable users interact with your site.
- Track trends in engagement and conversion among registered users.