Analyse Users Flow Reports
To view the Users Flow report in FirstHive CDP, navigate to: Behaviour > Users Flow.
Here, you’ll see a visual representation of the most popular pages and the paths your users followed over multiple interaction steps.
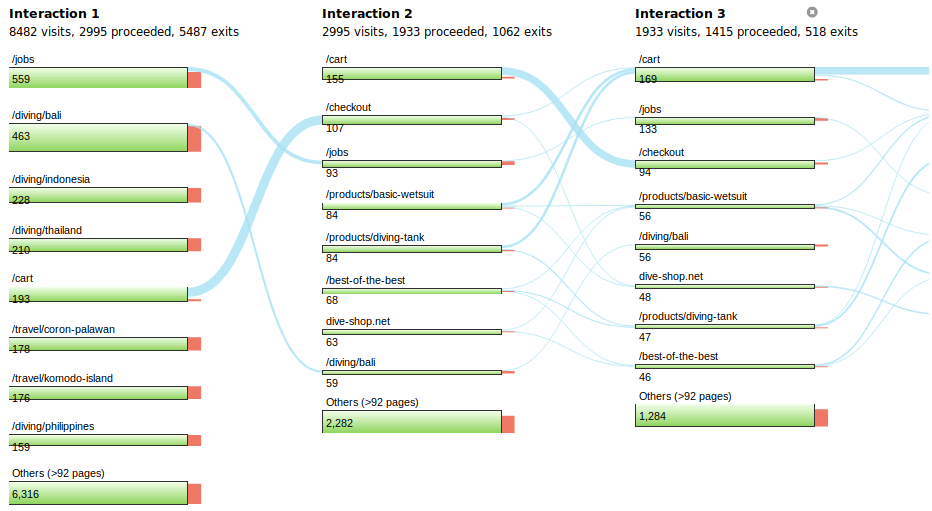
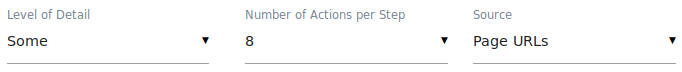
- Controls: In the top left, you can adjust the level of detail and set the number of actions per interaction step.
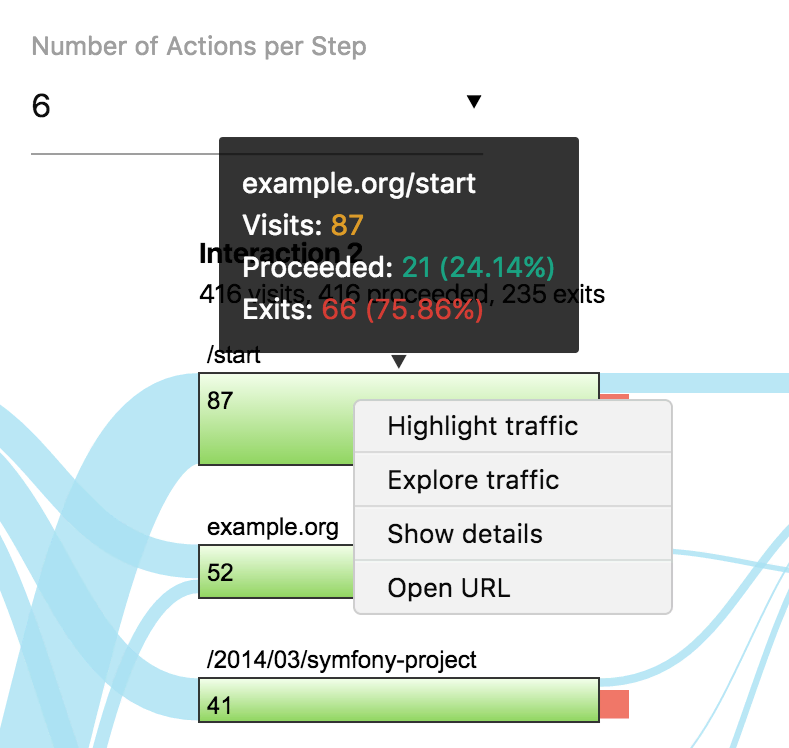
- Exploring interactions: Click on an interaction title or a green node, then select Show details to see a tabular list of all interactions.
- Grouped pages: Use the Explore traffic option on a node to see how users arrived at a particular page at a specific step, and where they went next. For example, you can analyze all visitors who landed on “/start” at step 2 and see their subsequent actions.
You can also add this visualization to your dashboard or export it to share with colleagues and stakeholders. The data is fully accessible within FirstHive CDP’s web interface.
Viewing the Most Popular Paths & Visitor Engagement
For additional insights, go to Behaviour > Top Paths. This report shows the most frequent paths your users take.
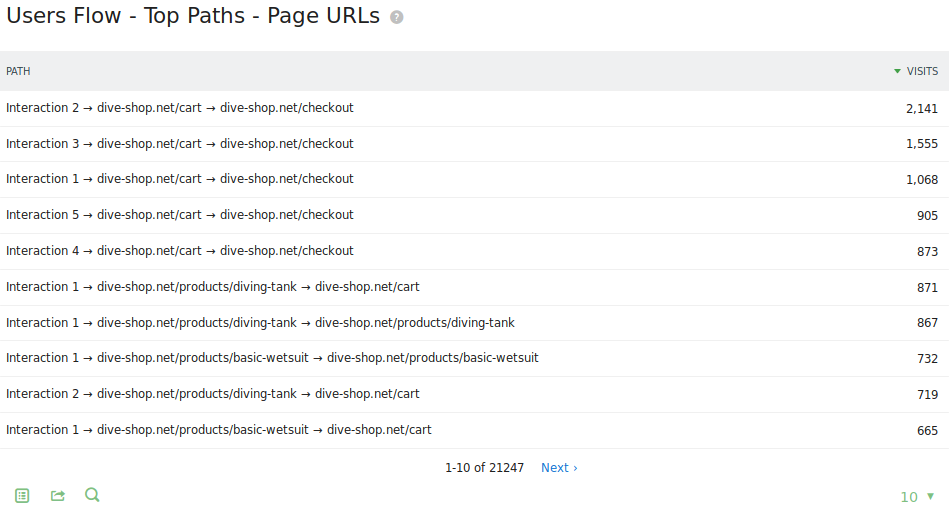
- Overview report: See how many interactions visitors completed before dropping off.
- Row details: Click on any row to view which pages were most visited at a specific step and what users did next.
- Tabular vs. visual view: While the data is the same as the Users Flow visualization, the tabular format can sometimes make patterns easier to analyze.

Applying Segments to Users Flow
Users Flow becomes even more powerful when combined with segments in FirstHive CDP. For example:
- New visitors: Apply the segment Visit type is new to analyze how first-time users navigate your site.
- Conversions: Use the segment Visit converted a specific goal to understand the journey of users who converted.
- Comparisons: Apply segments such as country, referrer, or campaign to compare how paths differ across audience groups.
With segments, you can tailor Users Flow to uncover deeper insights into user journeys, behaviors, and conversion patterns.