Visitors Overview Report
The Visitors Overview page provides a high-level summary of your website’s visitor numbers and engagement. You can access this page within the FirstHive CDP dashboard by clicking the Visitors menu item in the main navigation and then clicking on Overview.
The analytics data shown on this page is defined by data selectors at the top of the page. Make sure you take a moment to confirm that you have selected the correct website, date range, and segment that you’d like to analyse.
Visits Over Time
The top section provides a row evolution chart that enables you to see how visit metrics are trending over time. The default metric displayed for this chart is Visits. You can change which metrics are displayed by clicking on the line chart icon at the top left of the chart and selecting one or more other metrics to plot.
The metrics available on this page include:
- Visits
- Unique Visitors
- Users
- Avg. Visit Duration (in seconds)
- Bounce Rate
- Actions per Visit
- Maximum Actions in One Visit
- Visits with Conversions
- Pageviews
- Unique Pageviews
- Downloads
- Unique Downloads
- Outlinks
- Unique Outlinks
- Avg. Generation Time
You can select multiple metrics if you want to compare them. For example, compare the number of downloads with unique downloads to understand the reach of your downloadable content, or to check if the same visitors are downloading files multiple times.
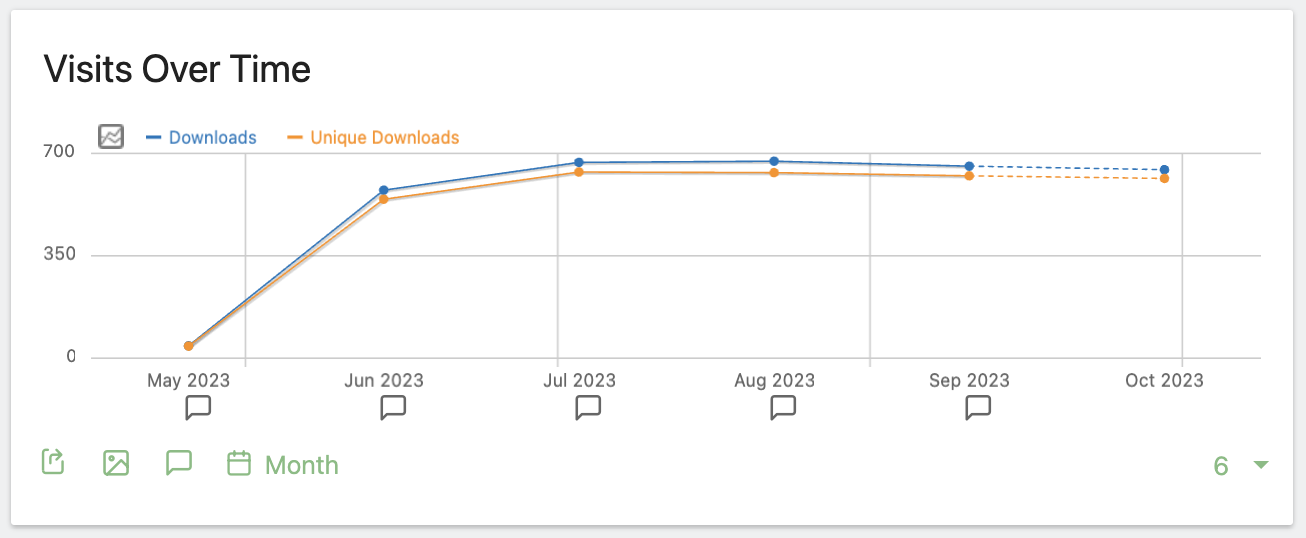
While working with data in this chart, you can also access all the usual row evolution options beneath the chart — such as exporting the data in various formats, or changing the reporting period and number of intervals.
Visits Overview
The Visits Overview section on the second half of the Overview page shows a collection of sparkline summaries, providing a snapshot of key visitor metrics over your selected date range.
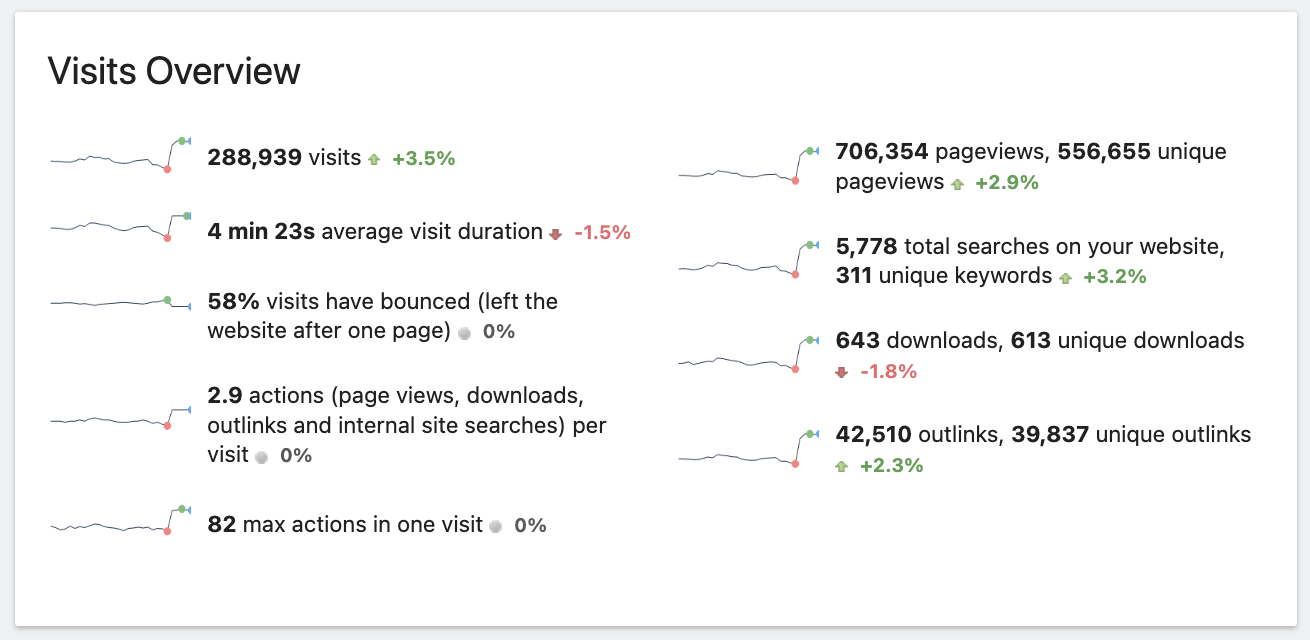
Each small line chart shows a simplified version of the visits-over-time trend, with a blue spot marking the high point and an orange spot marking the low point. Clicking on any of these metrics will automatically update the full evolution graph at the top of the page, allowing you to analyse those metrics in more detail.