Basket Analysis
The Basket Analytics feature in FirstHive CDP provides comprehensive market basket analysis capabilities to understand customer purchasing patterns and product relationships. This analytics tool helps identify which products are frequently bought together, enabling better cross-selling strategies and inventory management.
Key Features
Analysis Type Selection
- Primary Analysis: Basket Analysis (dropdown selection)
- Purpose: Analyze customer purchase patterns and product co-occurrence relationships
Product Co-occurrence Network
The network visualization displays product relationships based on purchasing patterns:
Network Components
- Nodes: Individual products represented as circles
- Node Size: Indicates product popularity or frequency in baskets
- Connections: Lines between products showing co-occurrence relationships
- Node Labels: Show product names with basket count in parentheses
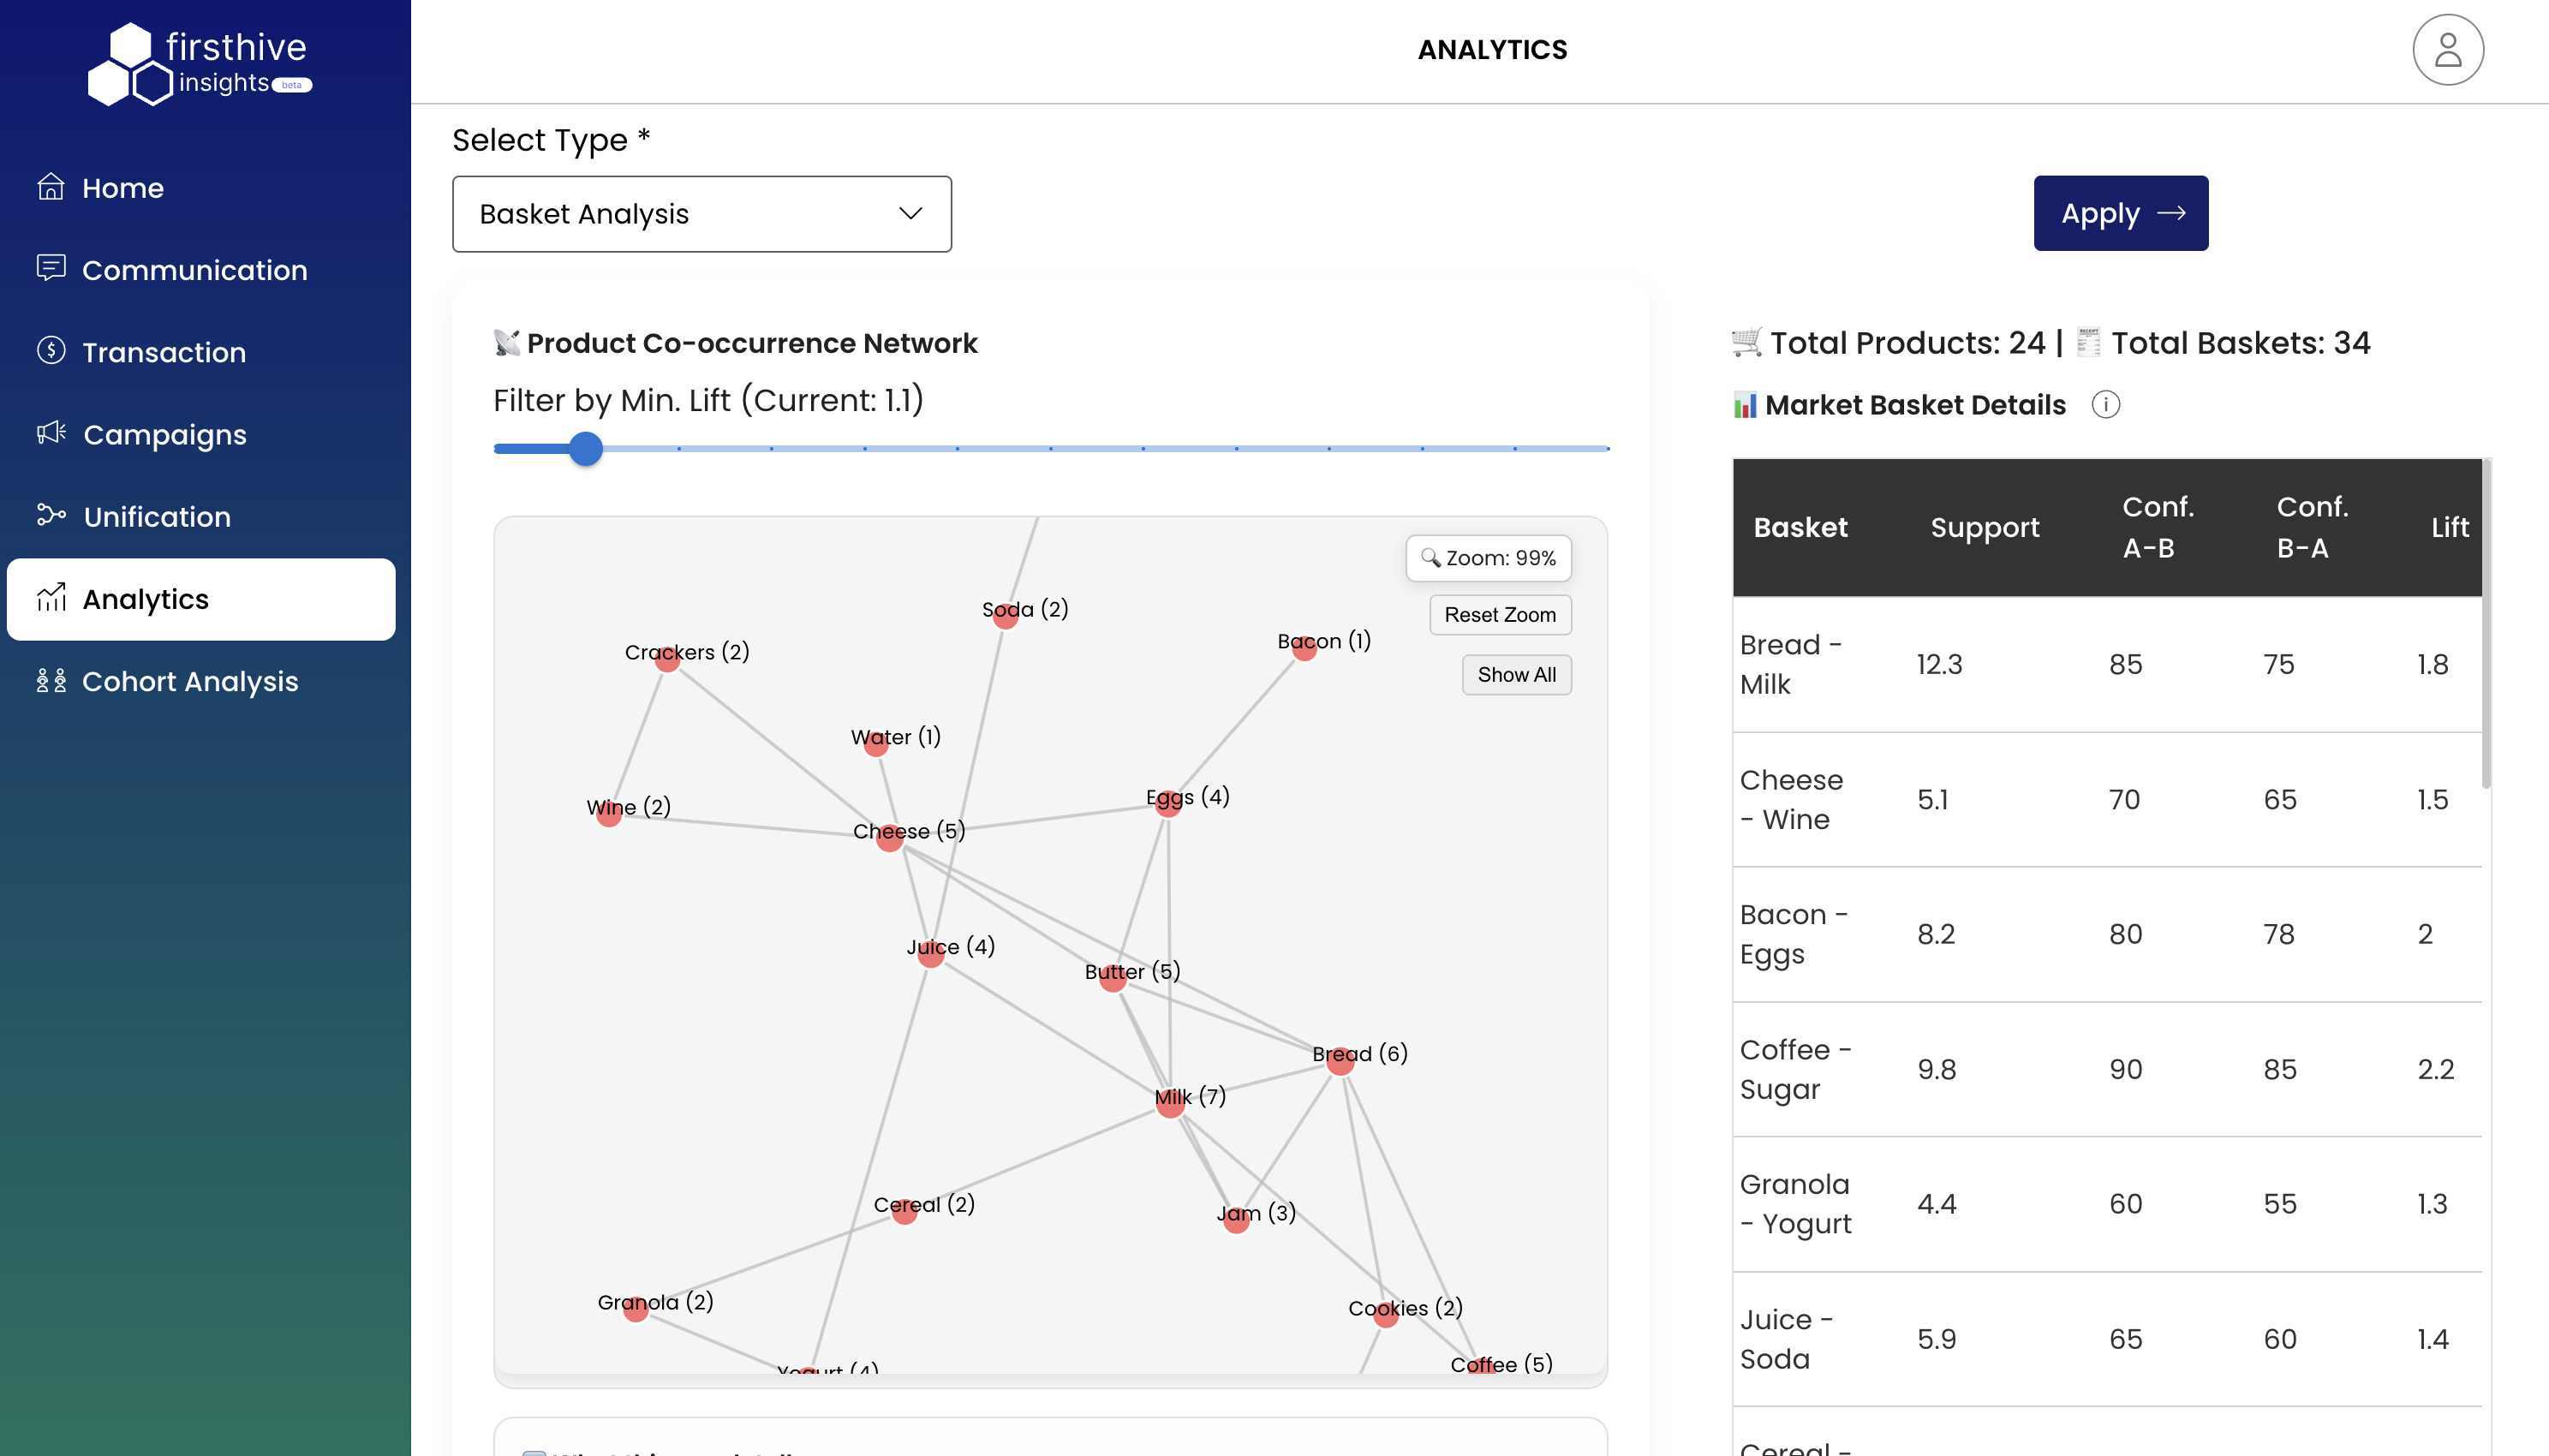
Interactive Controls
- Zoom Control: Currently set to 99% with zoom in/out capabilities
- Reset Zoom: Quick return to default view
- Show All: Display all network connections
- Min. Lift Filter: Slider control (Current: 1.1) to filter relationships by lift threshold
Market Basket Details Table
Comprehensive metrics table showing detailed basket analysis results:
Key Metrics Columns
- Basket: Product combination being analyzed
- Support: Percentage of transactions containing the item combination
- Conf. A→B: Confidence score for purchasing B when A is purchased
- Conf. B→A: Confidence score for purchasing A when B is purchased
- Lift: Measure of how much more likely items are bought together vs. independently
Sample Data Insights
| Product Combination | Support | Conf. A→B | Conf. B→A | Lift |
|---|---|---|---|---|
| Bread - Milk | 12.3% | 85% | 75% | 1.8 |
| Cheese - Wine | 5.1% | 70% | 65% | 1.5 |
| Bacon - Eggs | 8.2% | 80% | 78% | 2.0 |
| Coffee - Sugar | 9.8% | 90% | 85% | 2.2 |
| Granola - Yogurt | 4.4% | 60% | 55% | 1.3 |
| Juice - Soda | 5.9% | 65% | 60% | 1.4 |
Key Benefits
Cross-Selling Optimization
- Identify high-confidence product combinations
- Focus on relationships with lift > 1.5 for effective cross-selling
- In the example above, Coffee-Sugar shows highest lift (2.2) indicating strong association
Inventory Management
- Products with high support percentages indicate popular items
- Network centrality shows which products are purchasing drivers
- Optimize stock levels based on co-occurrence patterns
Marketing Strategy
- Target customers who buy one product with offers for complementary items
- Create product bundles based on high-confidence associations
- Personalize recommendations using basket analysis insights
Usage Guidelines
Interpreting Metrics
- Support > 10%: High-frequency combinations worth prioritizing
- Confidence > 70%: Strong predictive relationships
- Lift > 2.0: Exceptional product affinity, prime for bundling
- Lift = 1.0: Products purchased independently
- Lift < 1.0: Products rarely bought together
Filter Optimization
- Min. Lift 1.1+: Focus on meaningful relationships above random chance
- Higher Lift Thresholds: Identify strongest product affinities
- Network Pruning: Use filters to reduce complexity and focus on key relationships
Actionable Insights
- High-Lift Pairs: Coffee-Sugar (2.2), Bacon-Eggs (2.0) - Create bundles
- Popular Combinations: Bread-Milk (12.3% support) - Ensure availability
- Cross-Category Opportunities: Cheese-Wine (1.5 lift) - Lifestyle marketing
Best Practices
- Regularly update analysis with new transaction data
- Adjust lift thresholds based on business objectives
- Combine basket insights with customer segmentation
- Monitor seasonal variations in product associations
- Use network visualization to identify category bridges
Technical Notes
- Analysis includes minimum lift filtering for relevance
- Network layout optimized for relationship clarity
- Real-time zoom and navigation controls
- Exportable data for further analysis and reporting