Campaign Summary
The Campaigns Dashboard in FirstHive CDP provides a comprehensive view of marketing campaign performance across multiple communication channels (Email, SMS, WhatsApp). This unified interface allows marketers to analyze campaign effectiveness through key engagement metrics.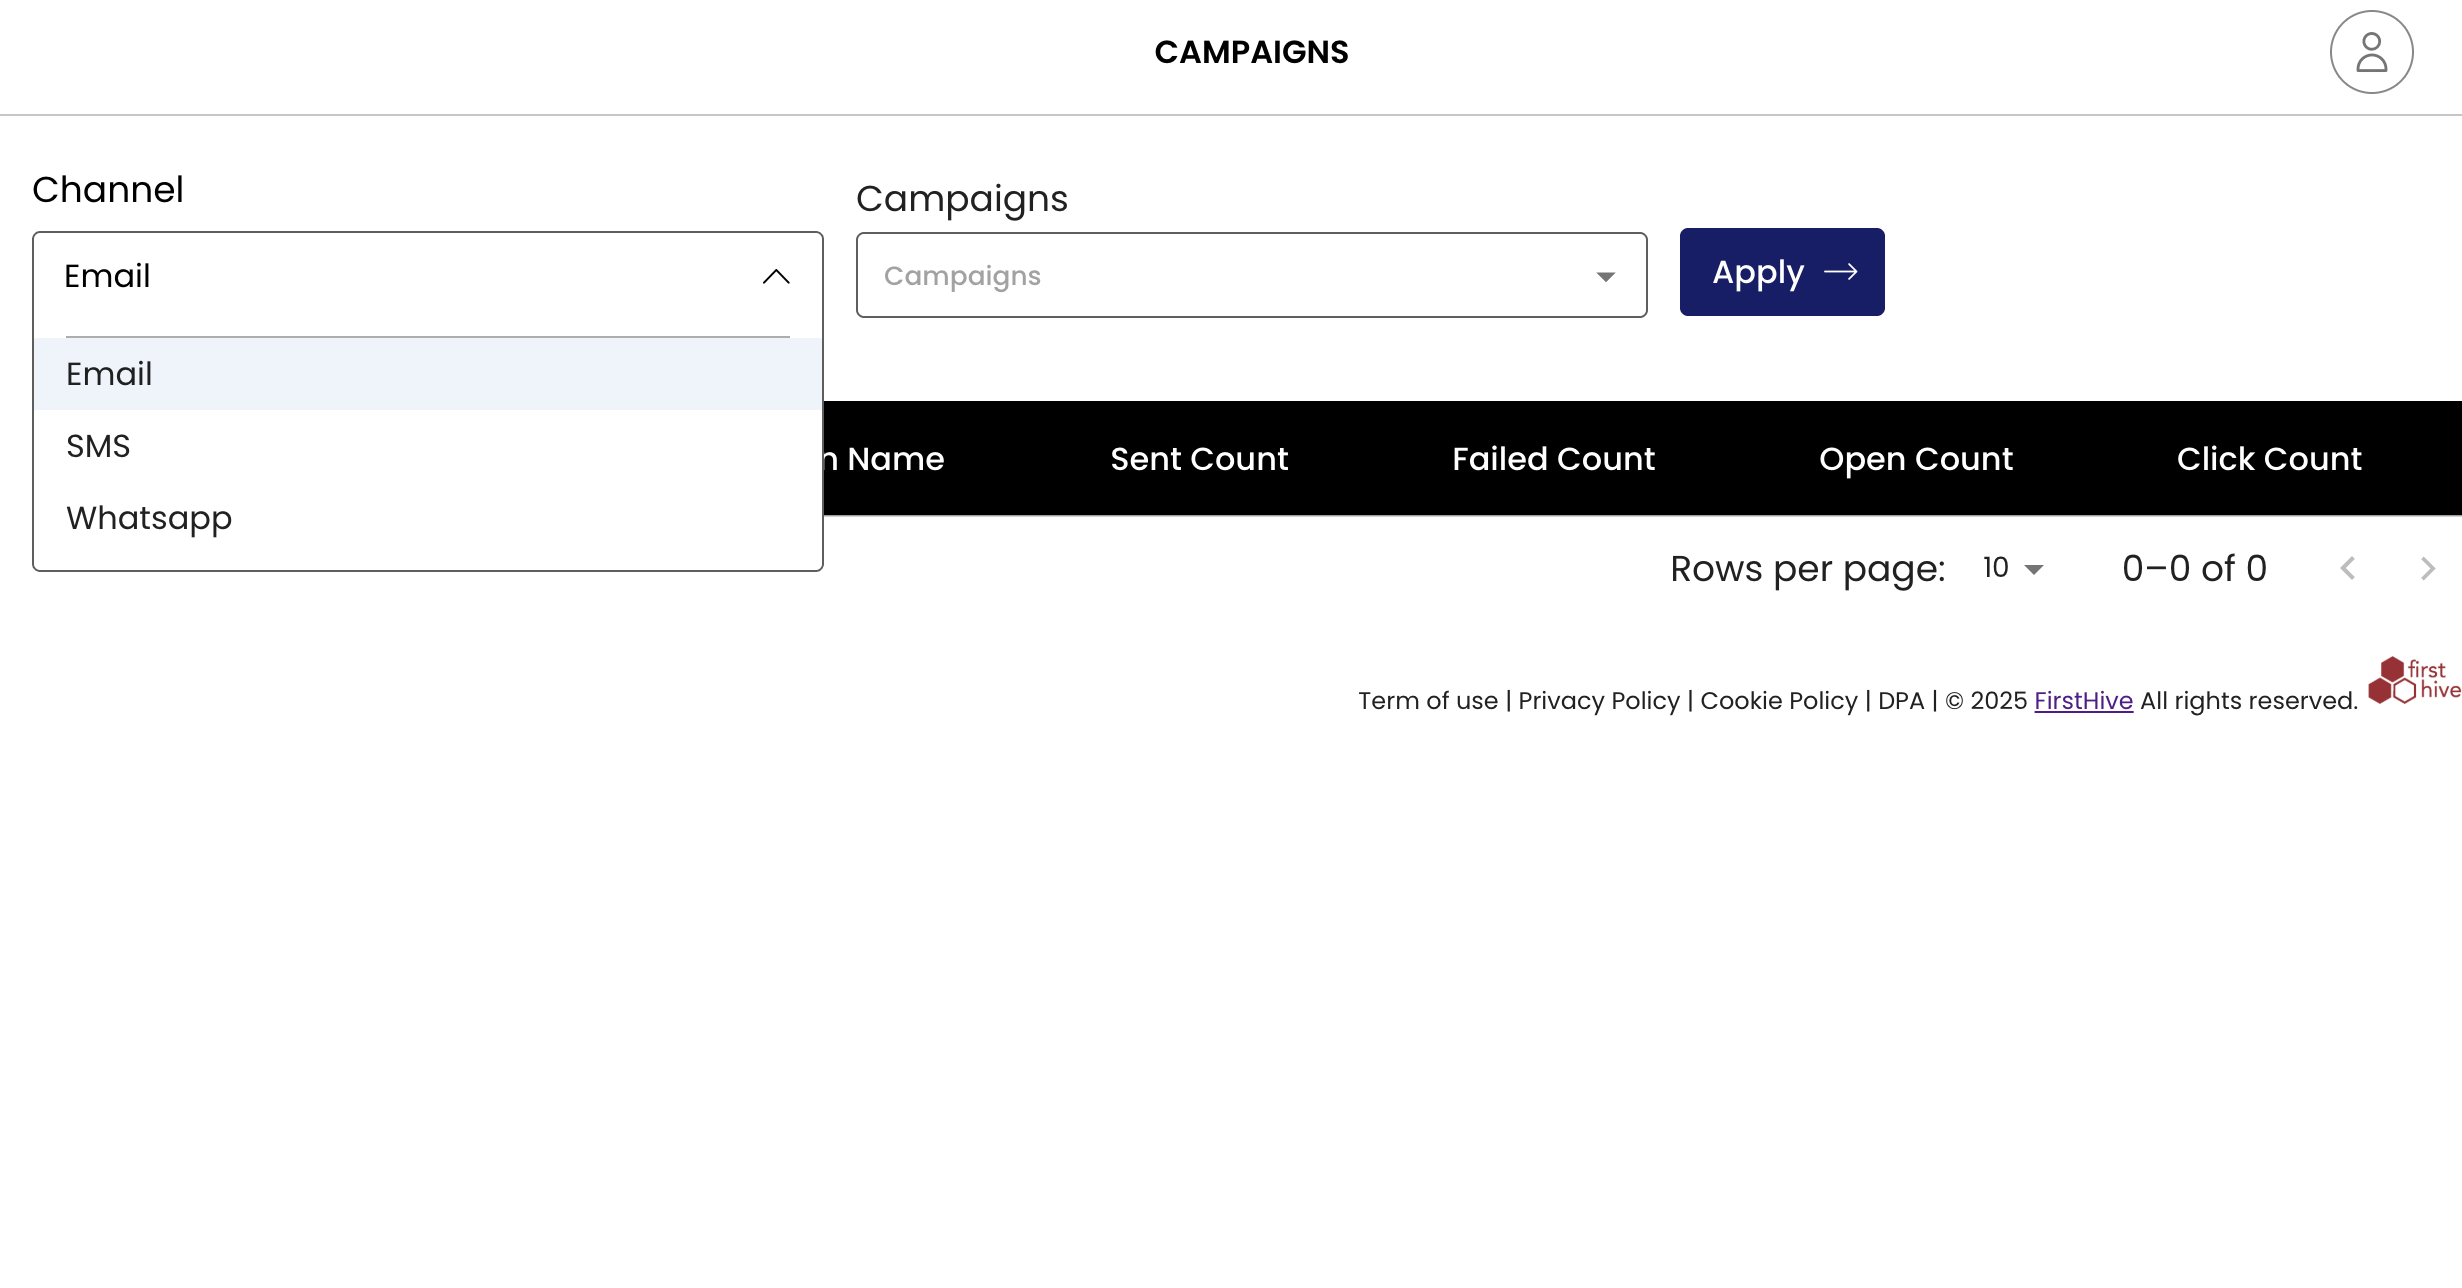
Dashboard Structure
Navigation and Filters
- Channel Filter: Dropdown selector allowing users to filter campaigns by communication channel:
- SMS
- Campaign Filter: Secondary dropdown to filter by specific campaign names or “All” campaigns
- Apply Button: Executes the selected filter criteria
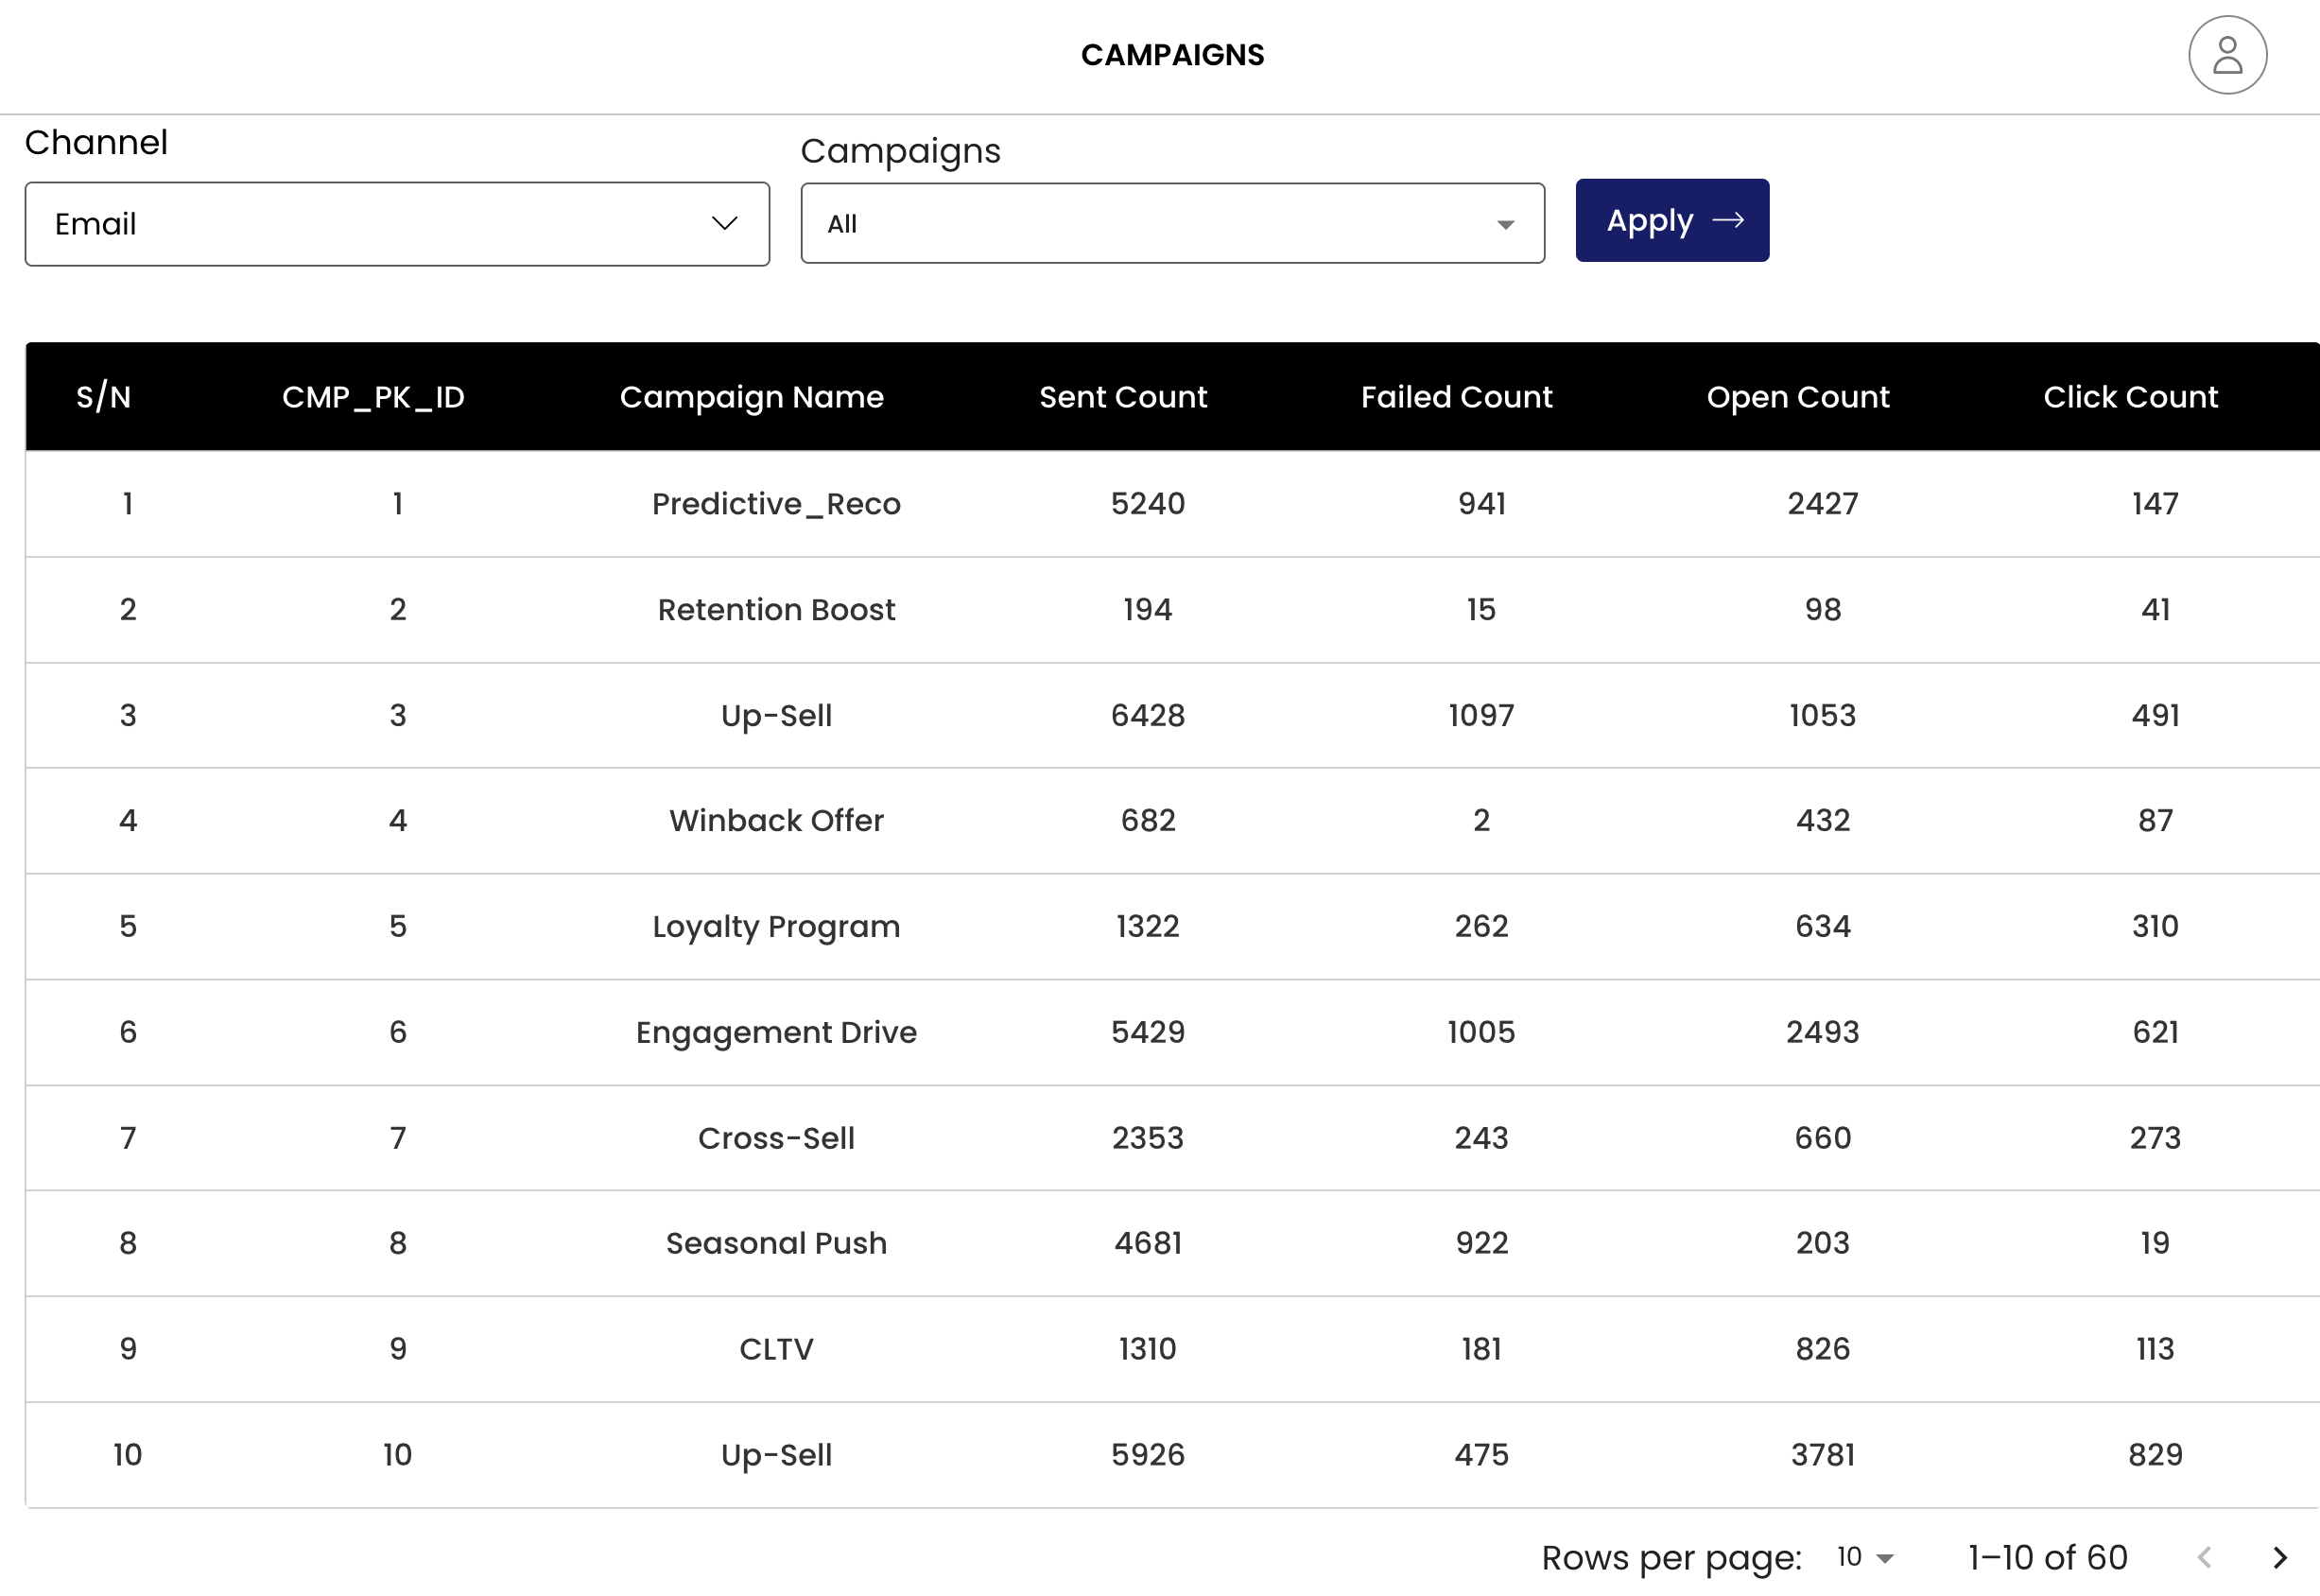
Data Table Structure
The main data table displays campaigns with the following columns:
| Column | Description |
|---|---|
| S/N | Sequential number for easy reference |
| CMP_PK_ID | Unique campaign primary key identifier |
| Campaign Name | Human-readable campaign name |
| Sent Count | Total number of messages sent |
| Failed Count | Number of messages that failed to deliver |
| Open Count | Number of messages opened by recipients |
| Click Count | Number of clicks on campaign content |
Campaign Types and Performance Analysis
Key Performance Indicators (KPIs)
Delivery Metrics
- Delivery Rate: (Sent Count - Failed Count) / Sent Count × 100
- Failure Rate: Failed Count / Sent Count × 100
Engagement Metrics
- Open Rate: Open Count / (Sent Count - Failed Count) × 100
- Click Rate: Click Count / Open Count × 100
- Click-to-Send Rate: Click Count / Sent Count × 100
Channel-Specific Insights
Email Performance Characteristics
- Higher failure rates compared to other channels
- Variable open rates depending on campaign type
- Click rates generally correlate with campaign relevance
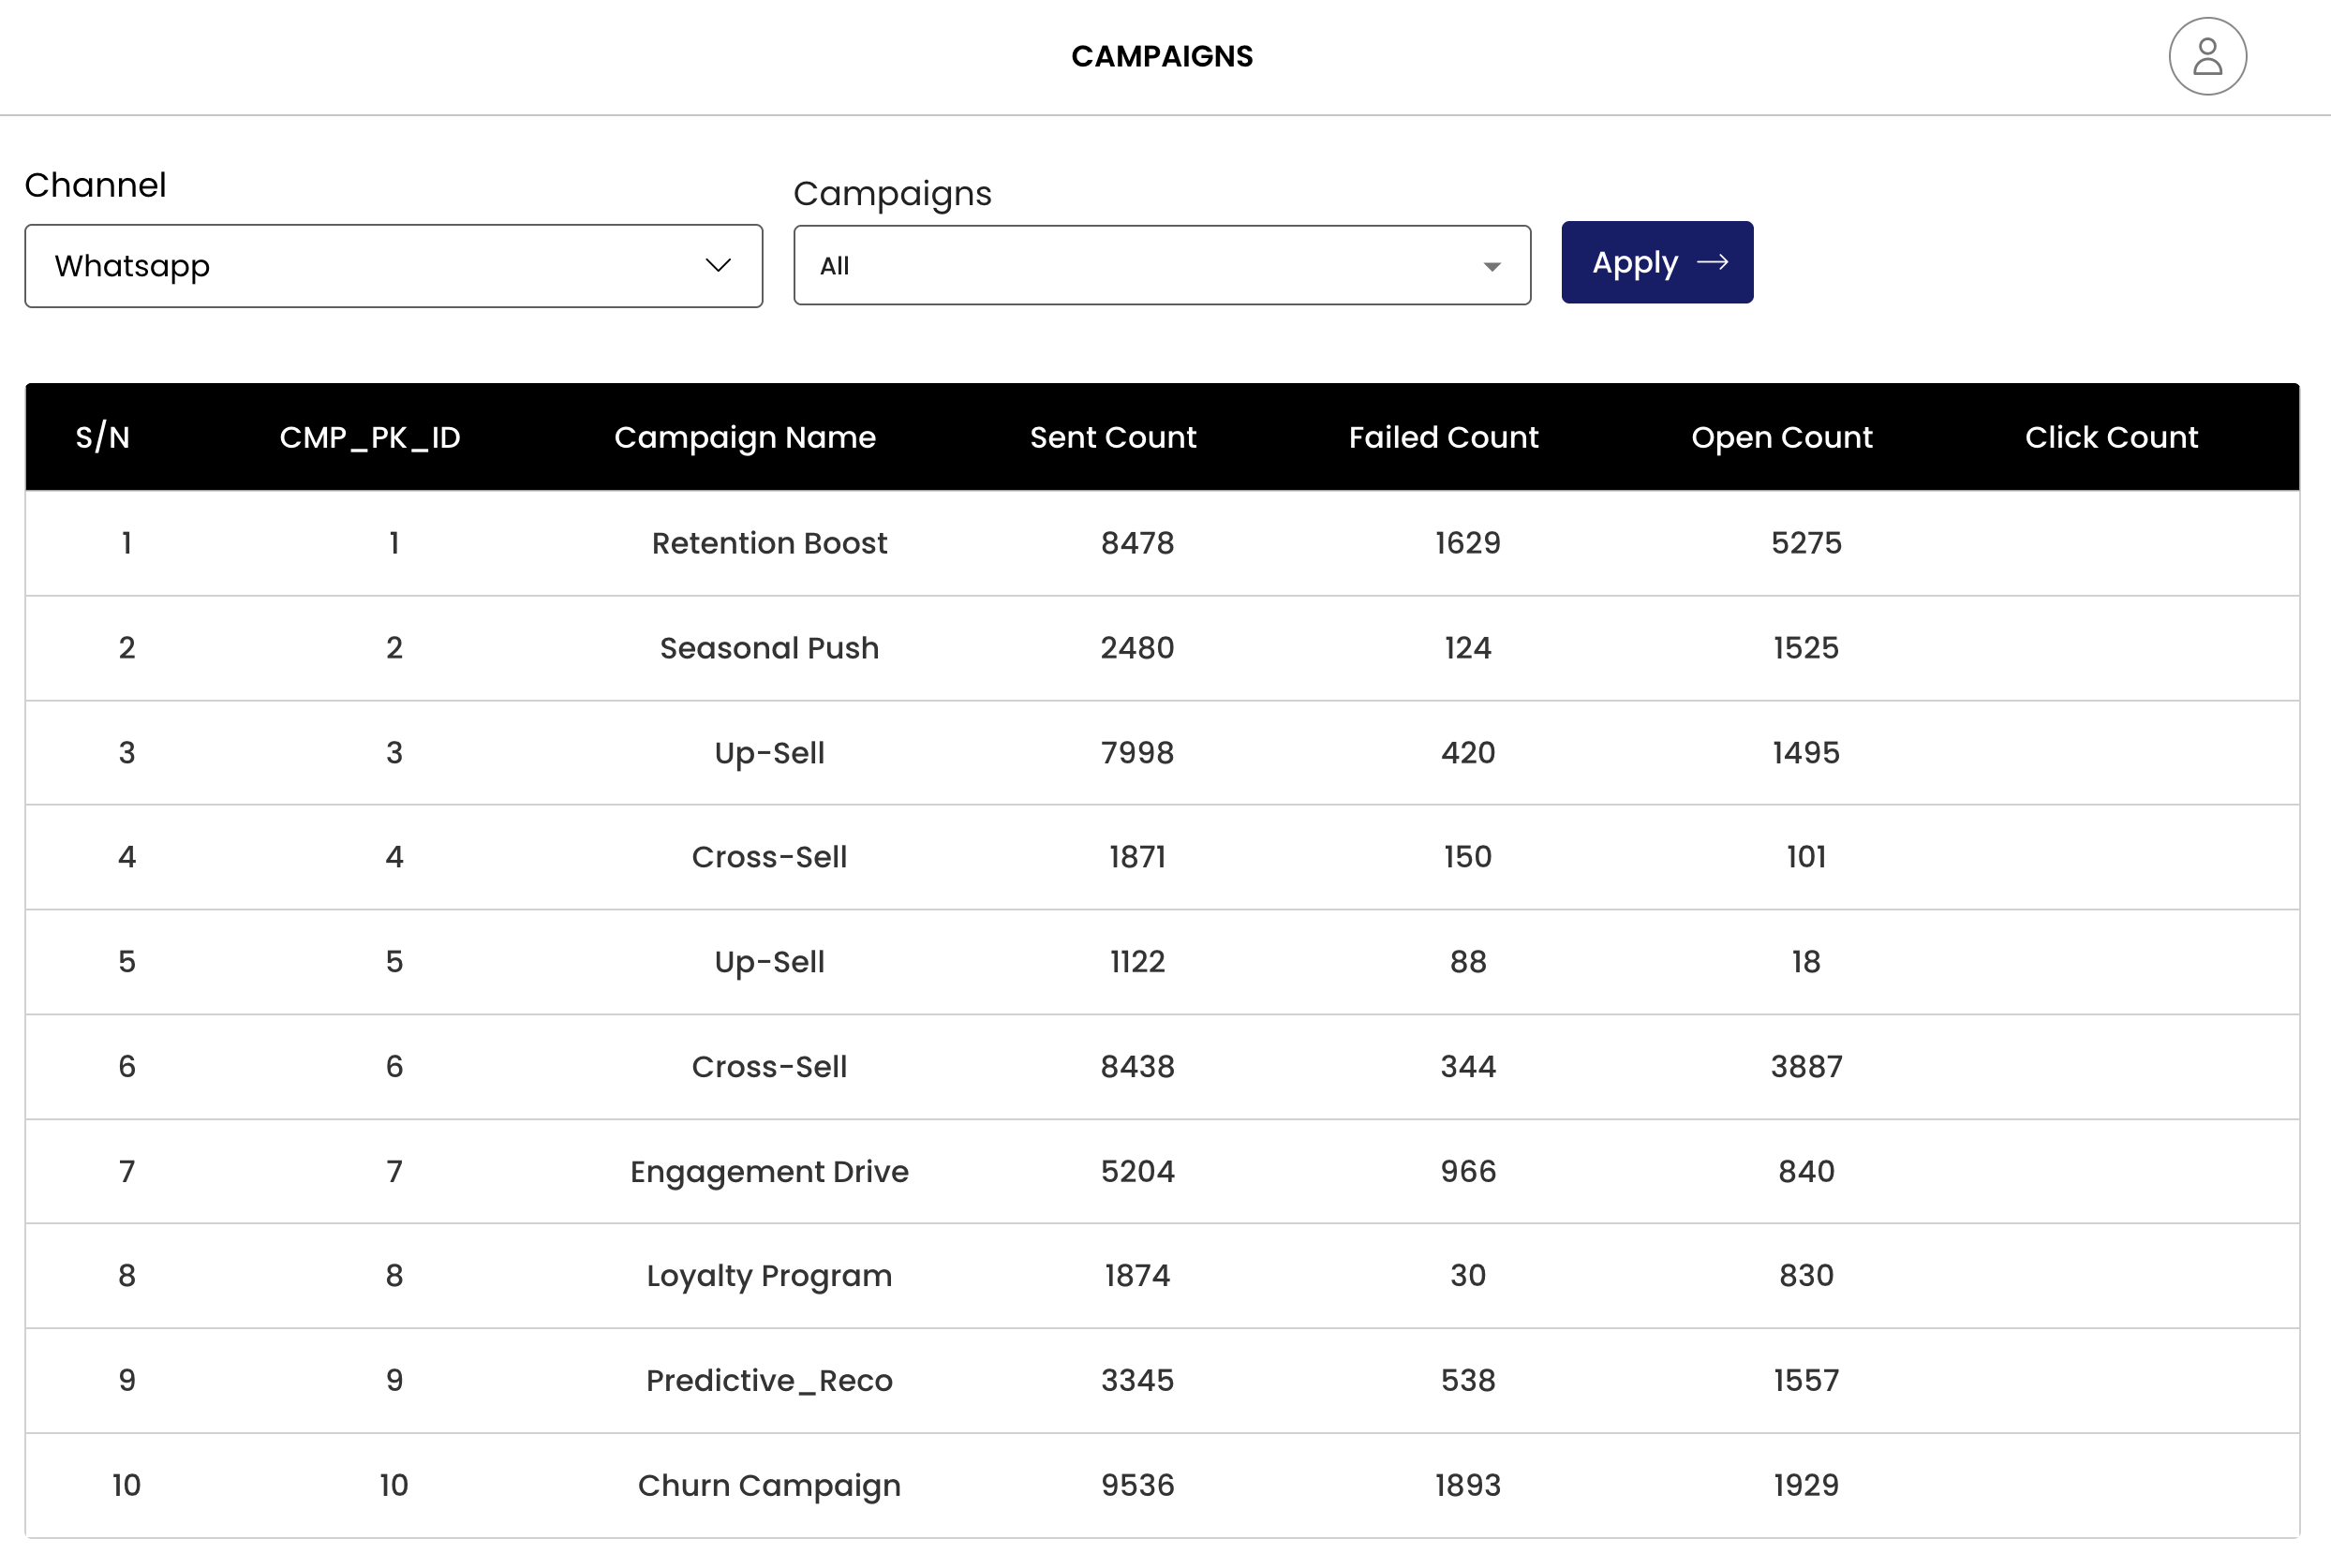
WhatsApp Performance Characteristics
- Generally lower failure rates
- Higher open rates, indicating better message visibility
- Strong performance for retention and engagement campaigns
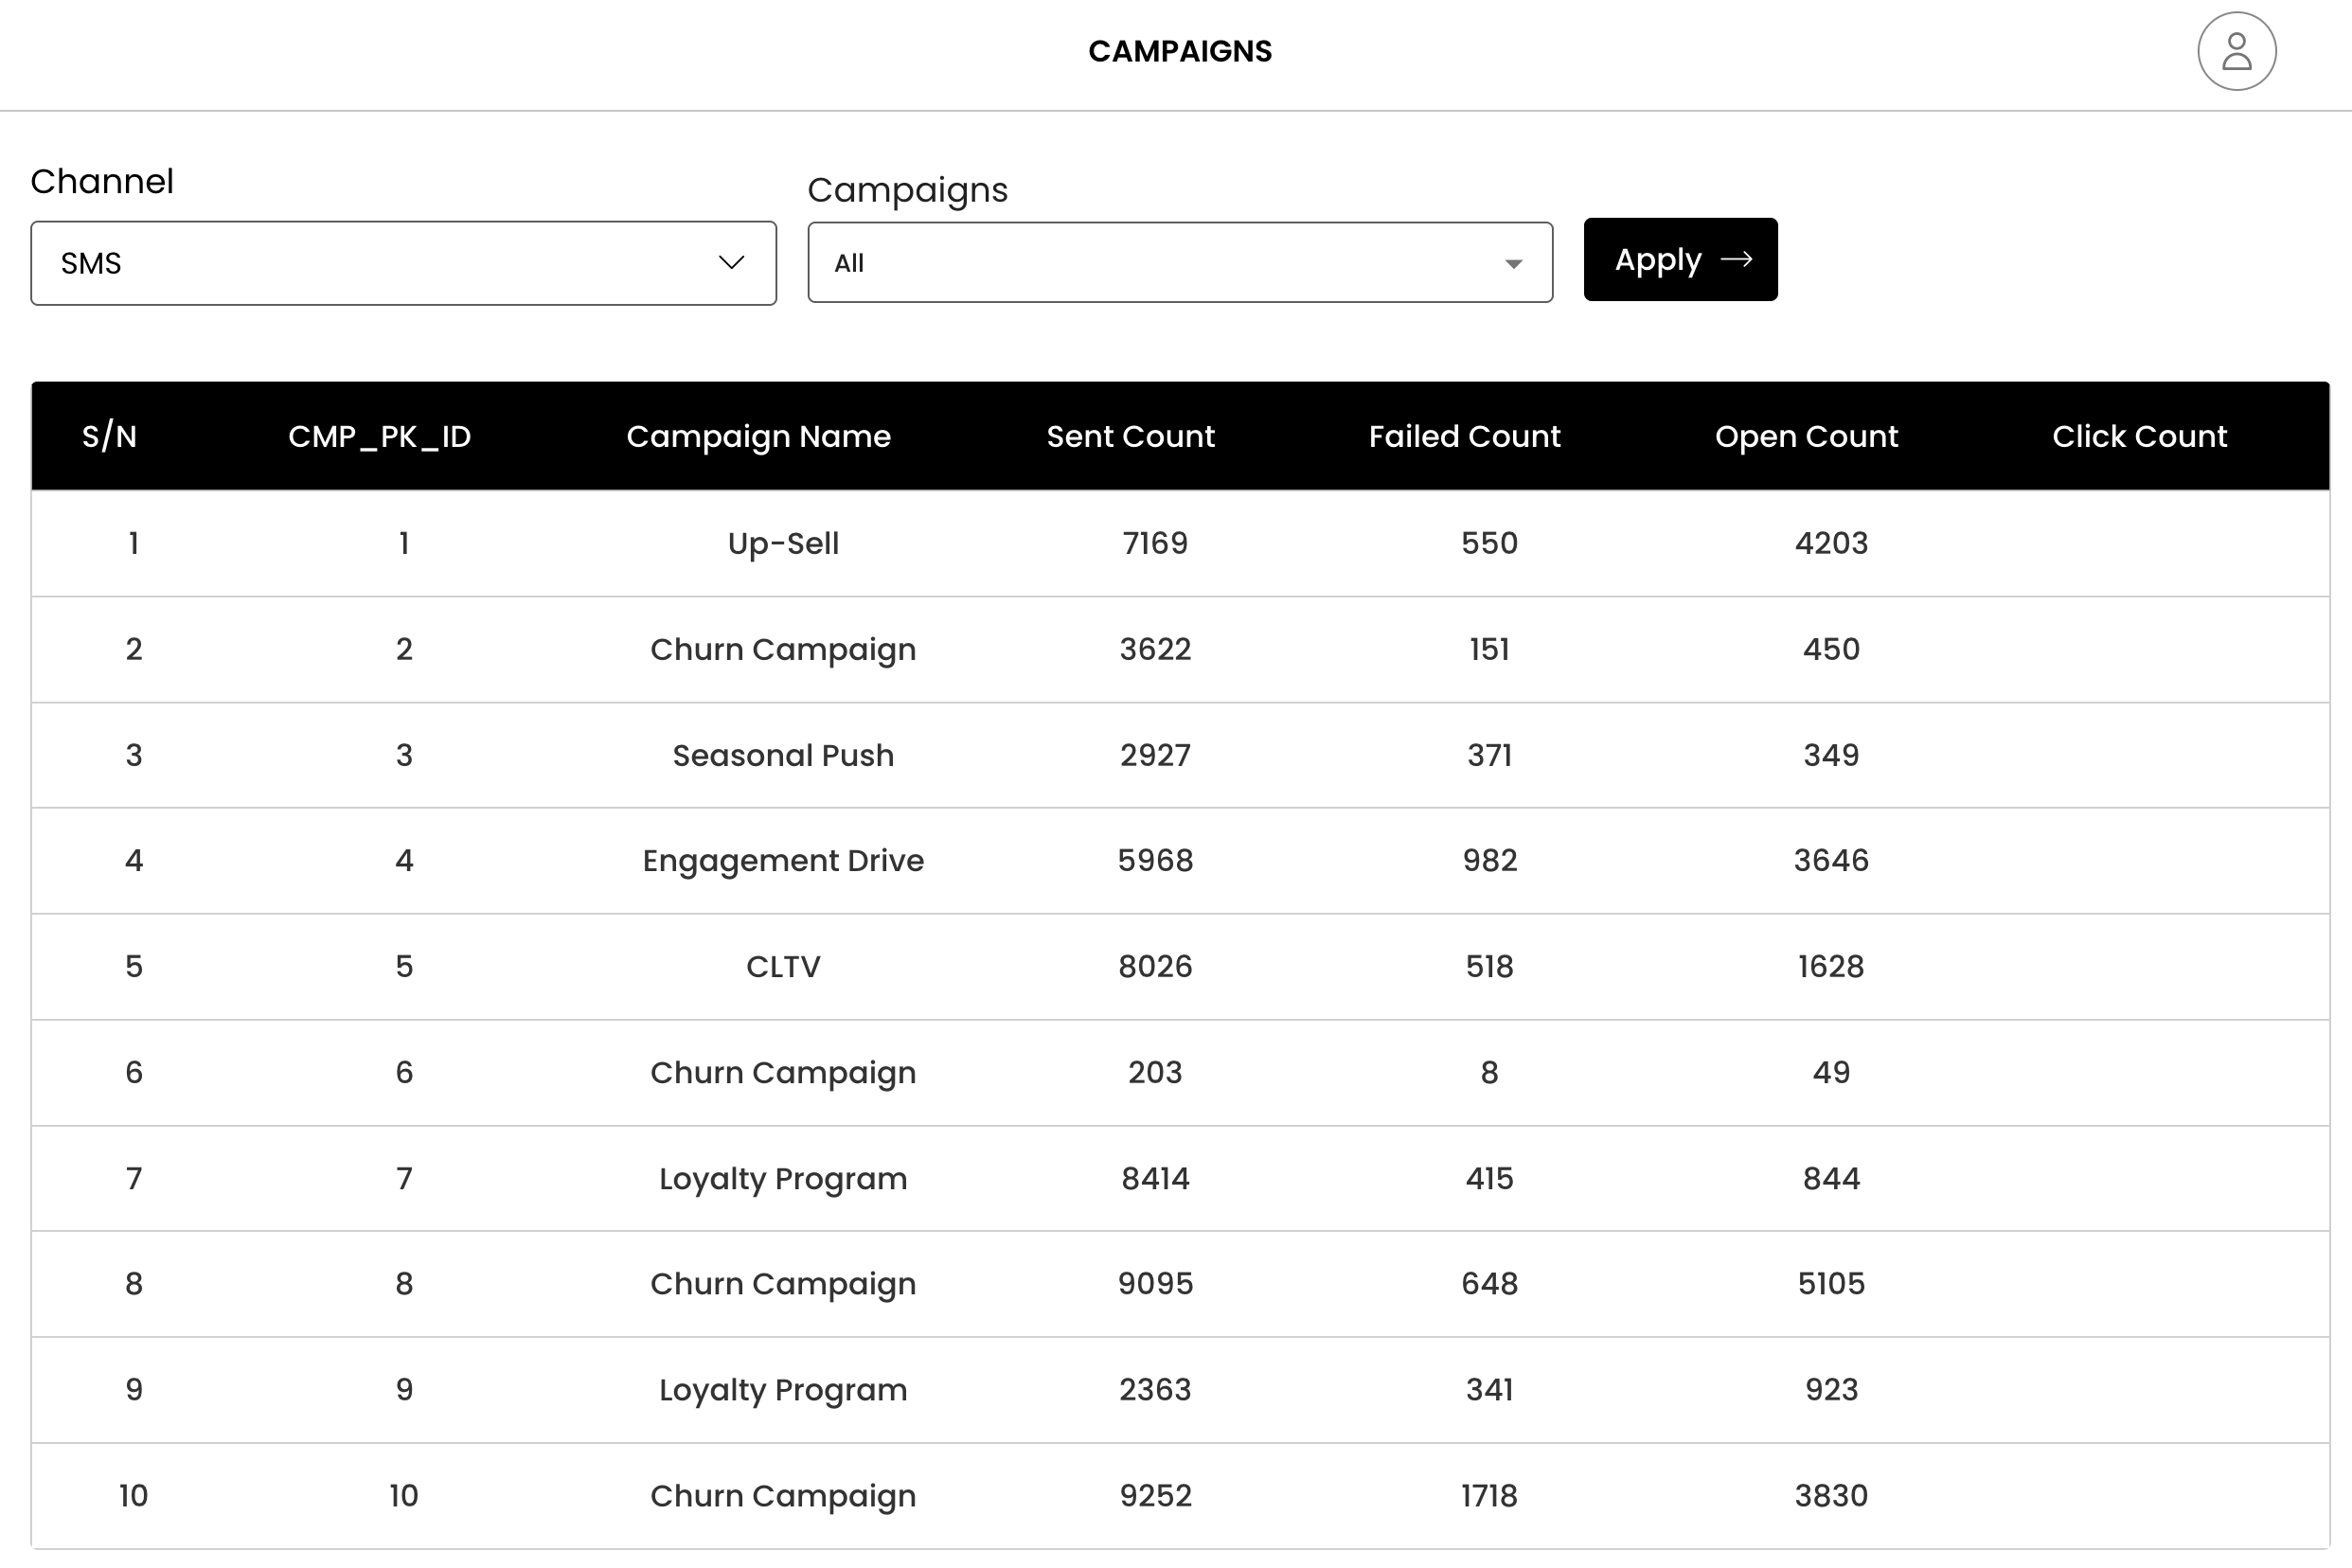
SMS Performance Characteristics
- Moderate failure rates
- Consistent delivery across campaign types
- Good engagement for targeted campaigns like Engagement Drive
Dashboard Usage Best Practices
Filtering and Analysis
- Channel Comparison: Use channel filters to compare campaign performance across different communication methods
- Campaign Analysis: Filter by specific campaigns to track performance over time
- Metric Correlation: Analyze the relationship between sent volume, opens, and clicks
Performance Monitoring
- Delivery Health: Monitor failed counts to identify delivery issues
- Engagement Trends: Track open and click rates to measure audience engagement
- Channel Optimization: Compare metrics across channels to optimize communication strategy
Data Export and Reporting
- Pagination allows for systematic review of large campaign datasets
- Configurable rows per page for different analysis needs
- Data structure supports export for further analysis
Technical Specifications - why do we need this section?
Data Refresh
- Real-time or near real-time campaign performance updates
- Historical data retention for trend analysis
User Interface
- Responsive design for different screen sizes
- Intuitive filtering system
- Clean tabular data presentation
Integration Points
- Campaign management system integration
- Customer data platform connectivity
- Analytics and reporting pipeline integration
Troubleshooting Common Issues
High Failure Rates
- Check contact data quality
- Verify channel-specific delivery requirements
- Review compliance with communication regulations
Low Engagement Rates
- Analyze campaign timing and frequency
- Review content relevance and personalization
- Consider audience segmentation improvements
Data Discrepancies
- Verify filter settings are correctly applied
- Check for data synchronization delays
- Confirm campaign status and completion