Churn Prediction
The Churn Prediction feature in FirstHive’s Customer Data Platform (CDP) is a predictive analytics tool that helps businesses identify customers who are at risk of churning (discontinuing their relationship with the business). This feature provides actionable insights to help companies proactively retain valuable customers.
Accessing Churn Prediction
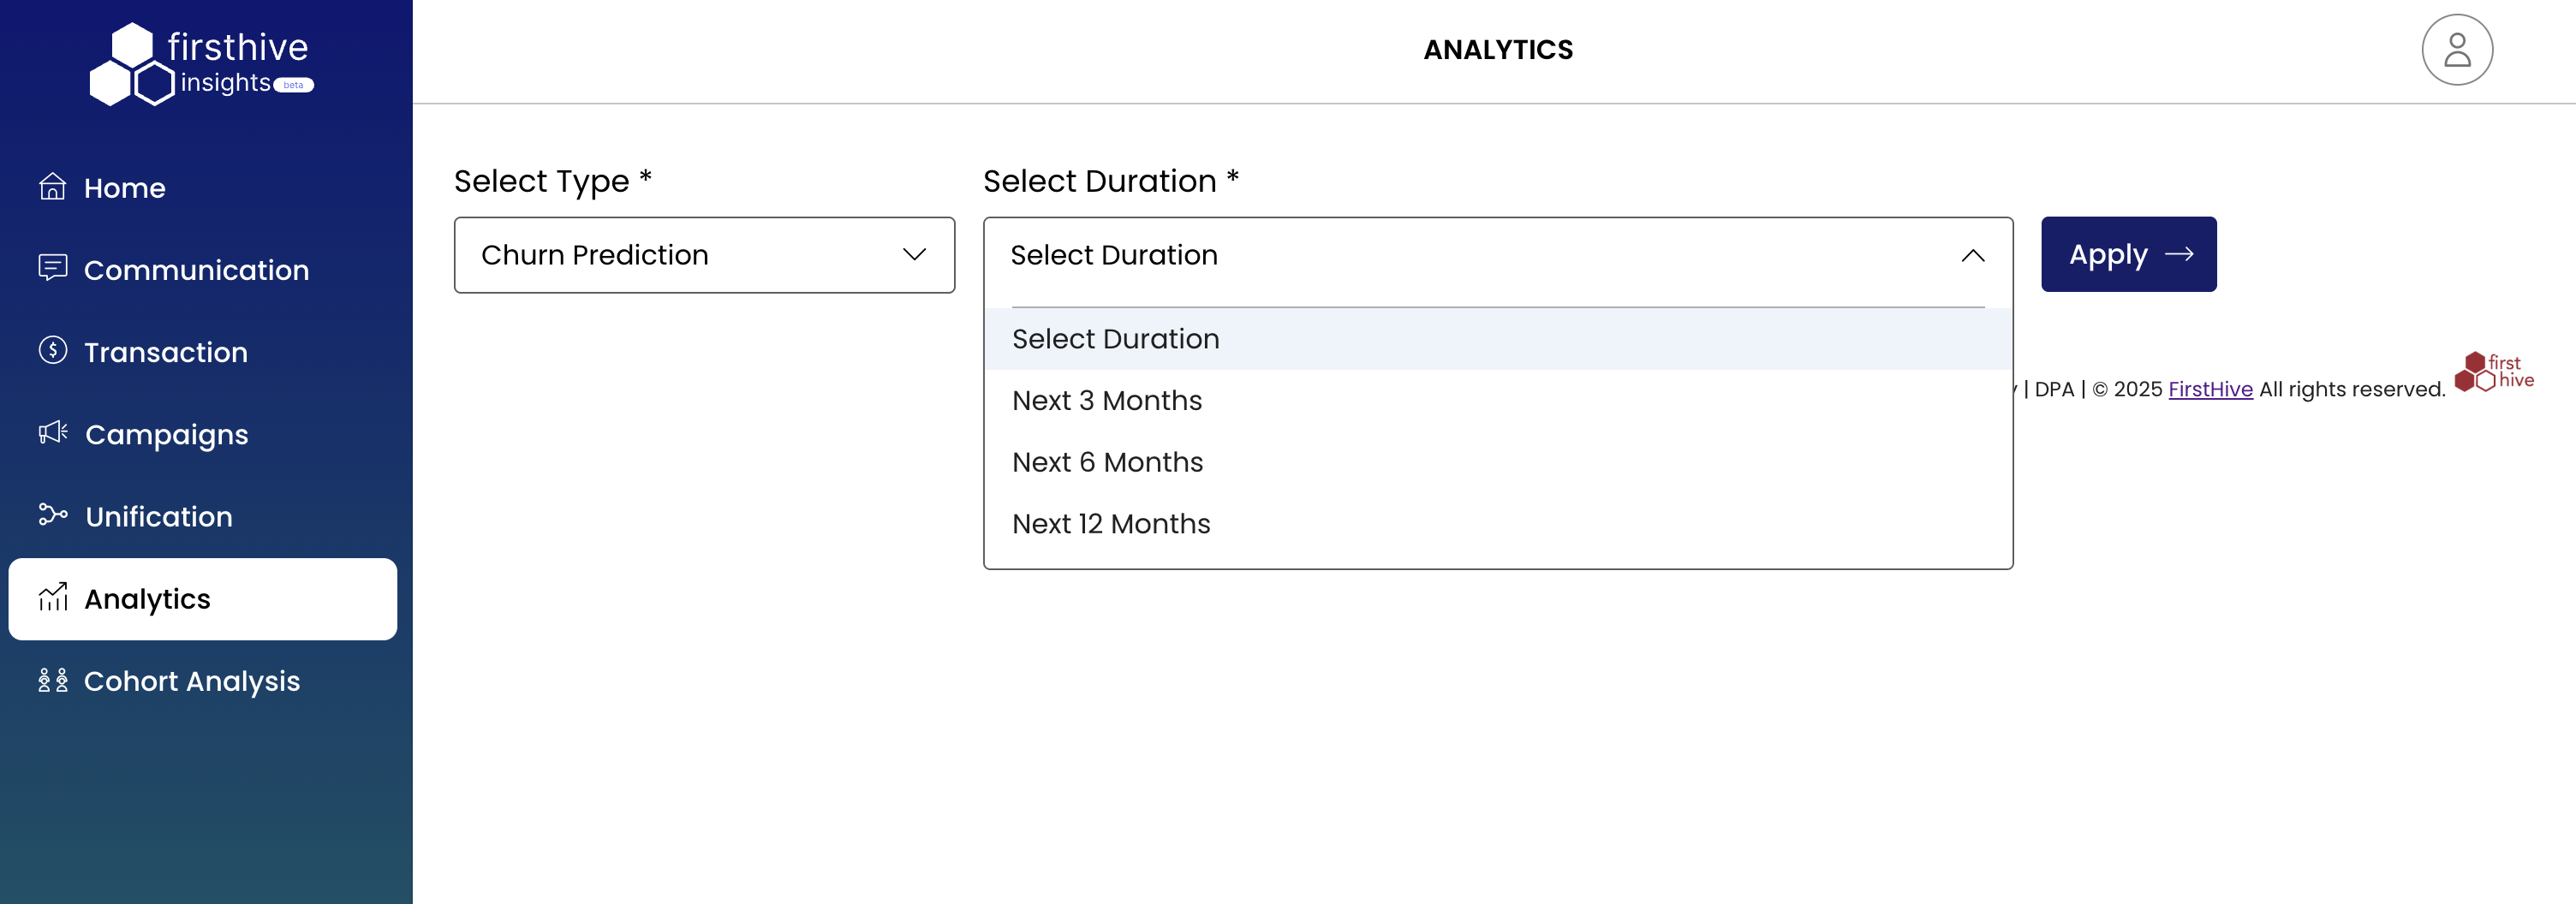
You can access Churn Prediction by logging into your FirstHive dashboard and navigating to Analytics > Churn Prediction from the left menu. This feature is part of the broader analytics suite, alongside tools like Cohort Analysis.
Key Features
Prediction Configuration
The churn prediction analysis can be customized with two main parameters:
Select Type
- Current Option: Churn Prediction
- Purpose: Defines the type of predictive analysis to perform
Select Duration
Available prediction timeframes:
- Next 3 Months - Short-term churn risk assessment
- Next 6 Months - Medium-term churn risk assessment
- Next 12 Months - Long-term churn risk assessment
Churn Risk Distribution Visualization
Risk Categories
The system categorizes customers into three distinct risk levels:
- High Risk (Red)
- Percentage: 19.84% of users
- Color Code: Red (#FF0000)
- Priority: Immediate attention required
- Medium Risk (Orange)
- Percentage: 61.11% of users
- Color Code: Orange (#FFA500)
- Priority: Moderate intervention needed
- Low Risk (Yellow/Green)
- Percentage: 19.05% of users
- Color Code: Yellow/Green
- Priority: Monitoring recommended
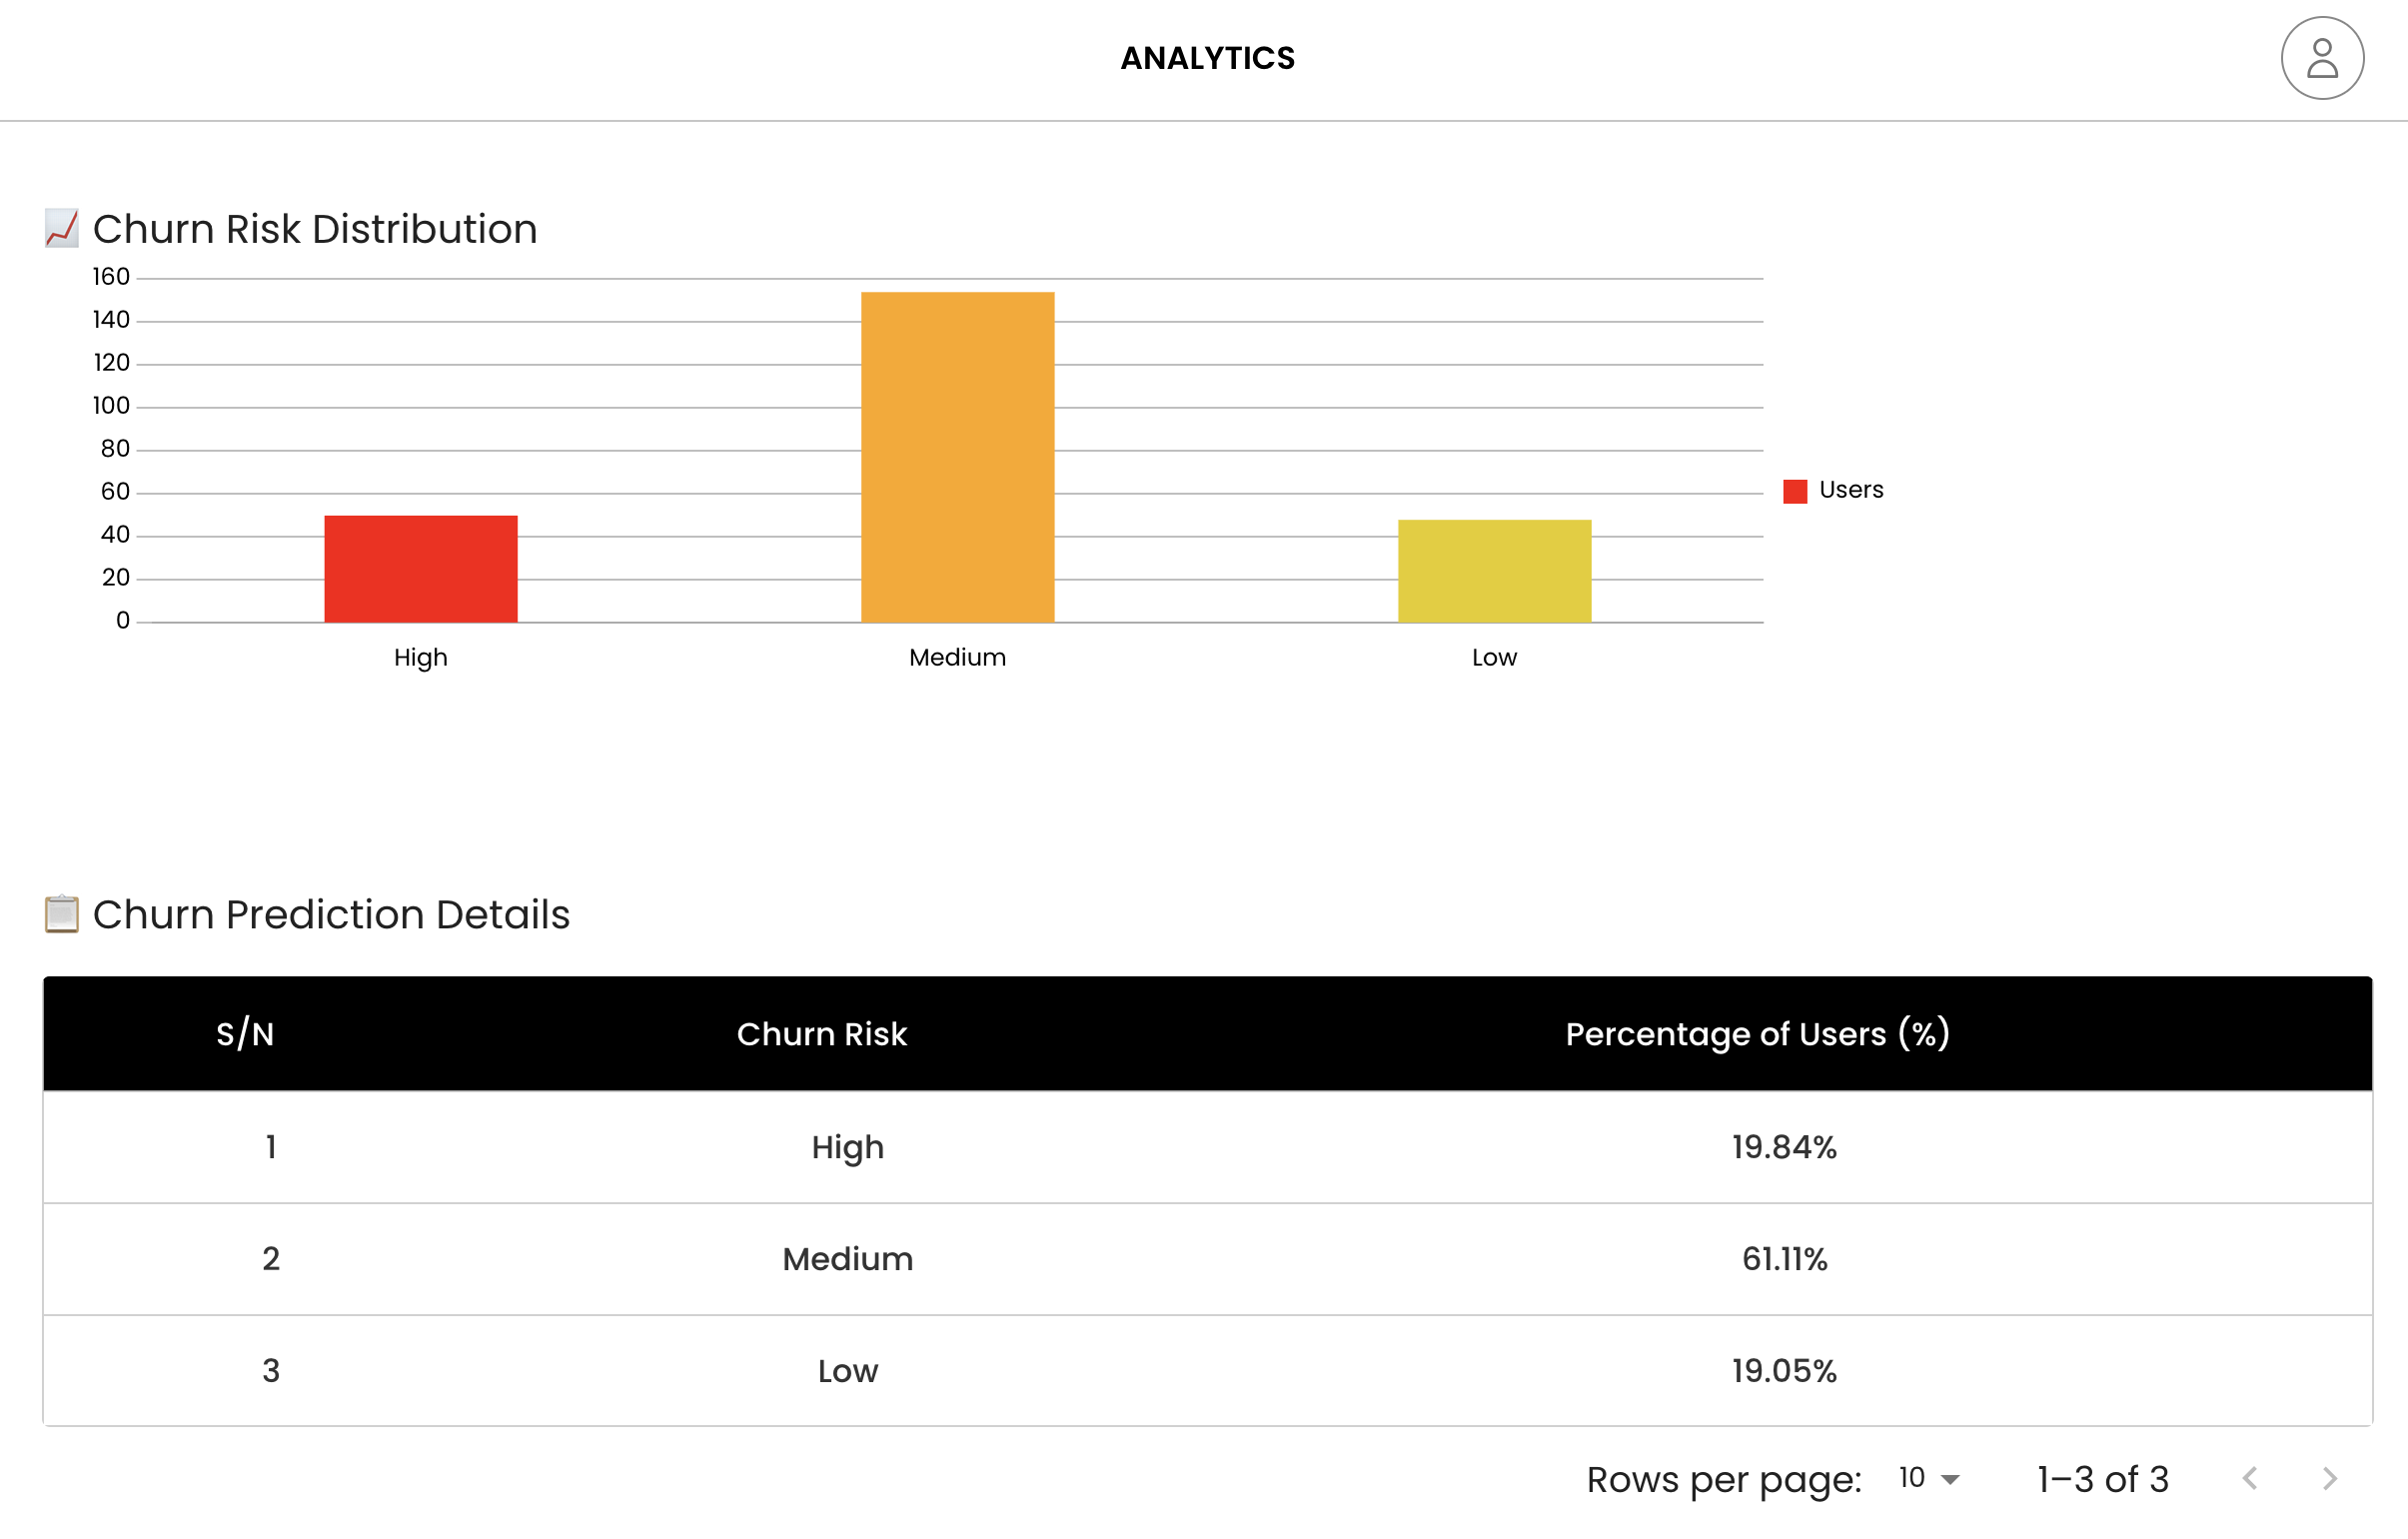
Visual Representation
- Chart Type: Horizontal bar chart
- Y-Axis: Risk categories (High, Medium, Low)
- X-Axis: Number of users (scale from 0 to 160)
- Legend: Red square indicator for “Users”
Detailed Analytics Table
Churn Prediction Details
A comprehensive data table displaying:
Columns:
- Churn Risk: Risk category classification
- Percentage of Users (%): Exact percentage breakdown
Data Summary:
| Risk Level | Percentage | User Distribution |
|---|---|---|
| High | 19.84% | Highest priority |
| Medium | 61.11% | Largest segment |
| Low | 19.05% | Lowest risk |
Business Insights
Risk Distribution Analysis
- Medium Risk Dominance: 61.11% of customers fall into the medium risk category, representing the largest segment requiring strategic attention
- Balanced Extremes: High and low risk segments are nearly equal (~19-20%), suggesting effective risk stratification
- Actionable Segments: Clear categorization enables targeted retention strategies for each risk level
Strategic Implications
- High Risk (19.84%): Immediate intervention campaigns needed
- Medium Risk (61.11%): Preventive engagement strategies recommended
- Low Risk (19.05%): Maintain current engagement levels with periodic monitoring
Understanding Churn Prediction through Use Cases
Proactive Customer Retention
Stay ahead of churn by identifying customers who may disengage. You can target these at-risk users with personalized retention campaigns and prioritize resources where they’ll have the most impact.
- Identify at-risk customers before they churn
- Deploy targeted retention campaigns
- Allocate resources based on risk priority
Marketing Campaign Optimization
Use churn predictions to make your marketing smarter. Segment customers by risk, tailor your messaging, and measure how campaigns reduce churn over time.
- Segment customers by churn risk
- Customize messaging for different risk levels
- Measure campaign effectiveness against churn reduction
Customer Success Management
Focus your customer success efforts where they matter most. Track risk levels over time, allocate account management resources efficiently, and ensure high-value customers remain engaged.
- Prioritize customer success efforts
- Allocate account management resources
- Track risk level changes over time
Technical Specifications
Data Processing
- Analysis Type: Predictive modeling
- Time Horizon: Configurable (3, 6, or 12 months)
- Update Frequency: Real-time or batch processing
- Data Sources: Unified customer data from CDP
Integration Points
- Analytics Dashboard: Embedded within FirstHive Analytics
- Export Capabilities: Data table supports pagination and likely export functions
- API Access: Presumed integration with FirstHive’s API ecosystem
Best Practices
Regular Monitoring
- Review churn predictions monthly or quarterly
- Track changes in risk distribution over time
- Adjust prediction timeframes based on business cycles
Action Planning
- Develop specific strategies for each risk category
- Set up automated alerts for high-risk customer identification
- Create feedback loops to improve prediction accuracy
Performance Measurement
- Track retention rates by risk category
- Measure ROI of intervention campaigns
- Monitor prediction accuracy and model performance
Limitations and Considerations
Data Quality Dependencies
- Predictions rely on comprehensive customer data
- Data freshness impacts prediction accuracy
- Missing customer touchpoints may affect risk assessment
Model Considerations
- Predictions are probabilistic, not deterministic
- Regular model retraining may be required
- Industry-specific factors should be considered