Customer Lifetime Value (CLTV) Prediction
The CLTV (Customer Lifetime Value) Prediction feature in FirstHive CDP provides advanced predictive analytics capabilities to segment customers based on their predicted lifetime value. This tool enables businesses to identify high-value customers and optimize marketing strategies accordingly.
CLTV Segment Classification
The system categorizes customers into four distinct CLTV segments based on predictive modeling:
High CLTV Segment
- Definition: Customers predicted to generate the highest lifetime value
- Color Code: Green
- Strategic Importance: Premium customers requiring VIP treatment and retention focus
Above Normal CLTV Segment
- Definition: Customers with above-average predicted lifetime value
- Color Code: Yellow
- Strategic Importance: Growth potential customers for upselling and cross-selling
Normal CLTV Segment
- Definition: Customers with average predicted lifetime value
- Color Code: Orange
- Strategic Importance: Standard engagement customers requiring consistent nurturing
Low CLTV Segment
- Definition: Customers with below-average predicted lifetime value
- Color Code: Red
- Strategic Importance: Cost-optimization focus with selective engagement
Dashboard Components
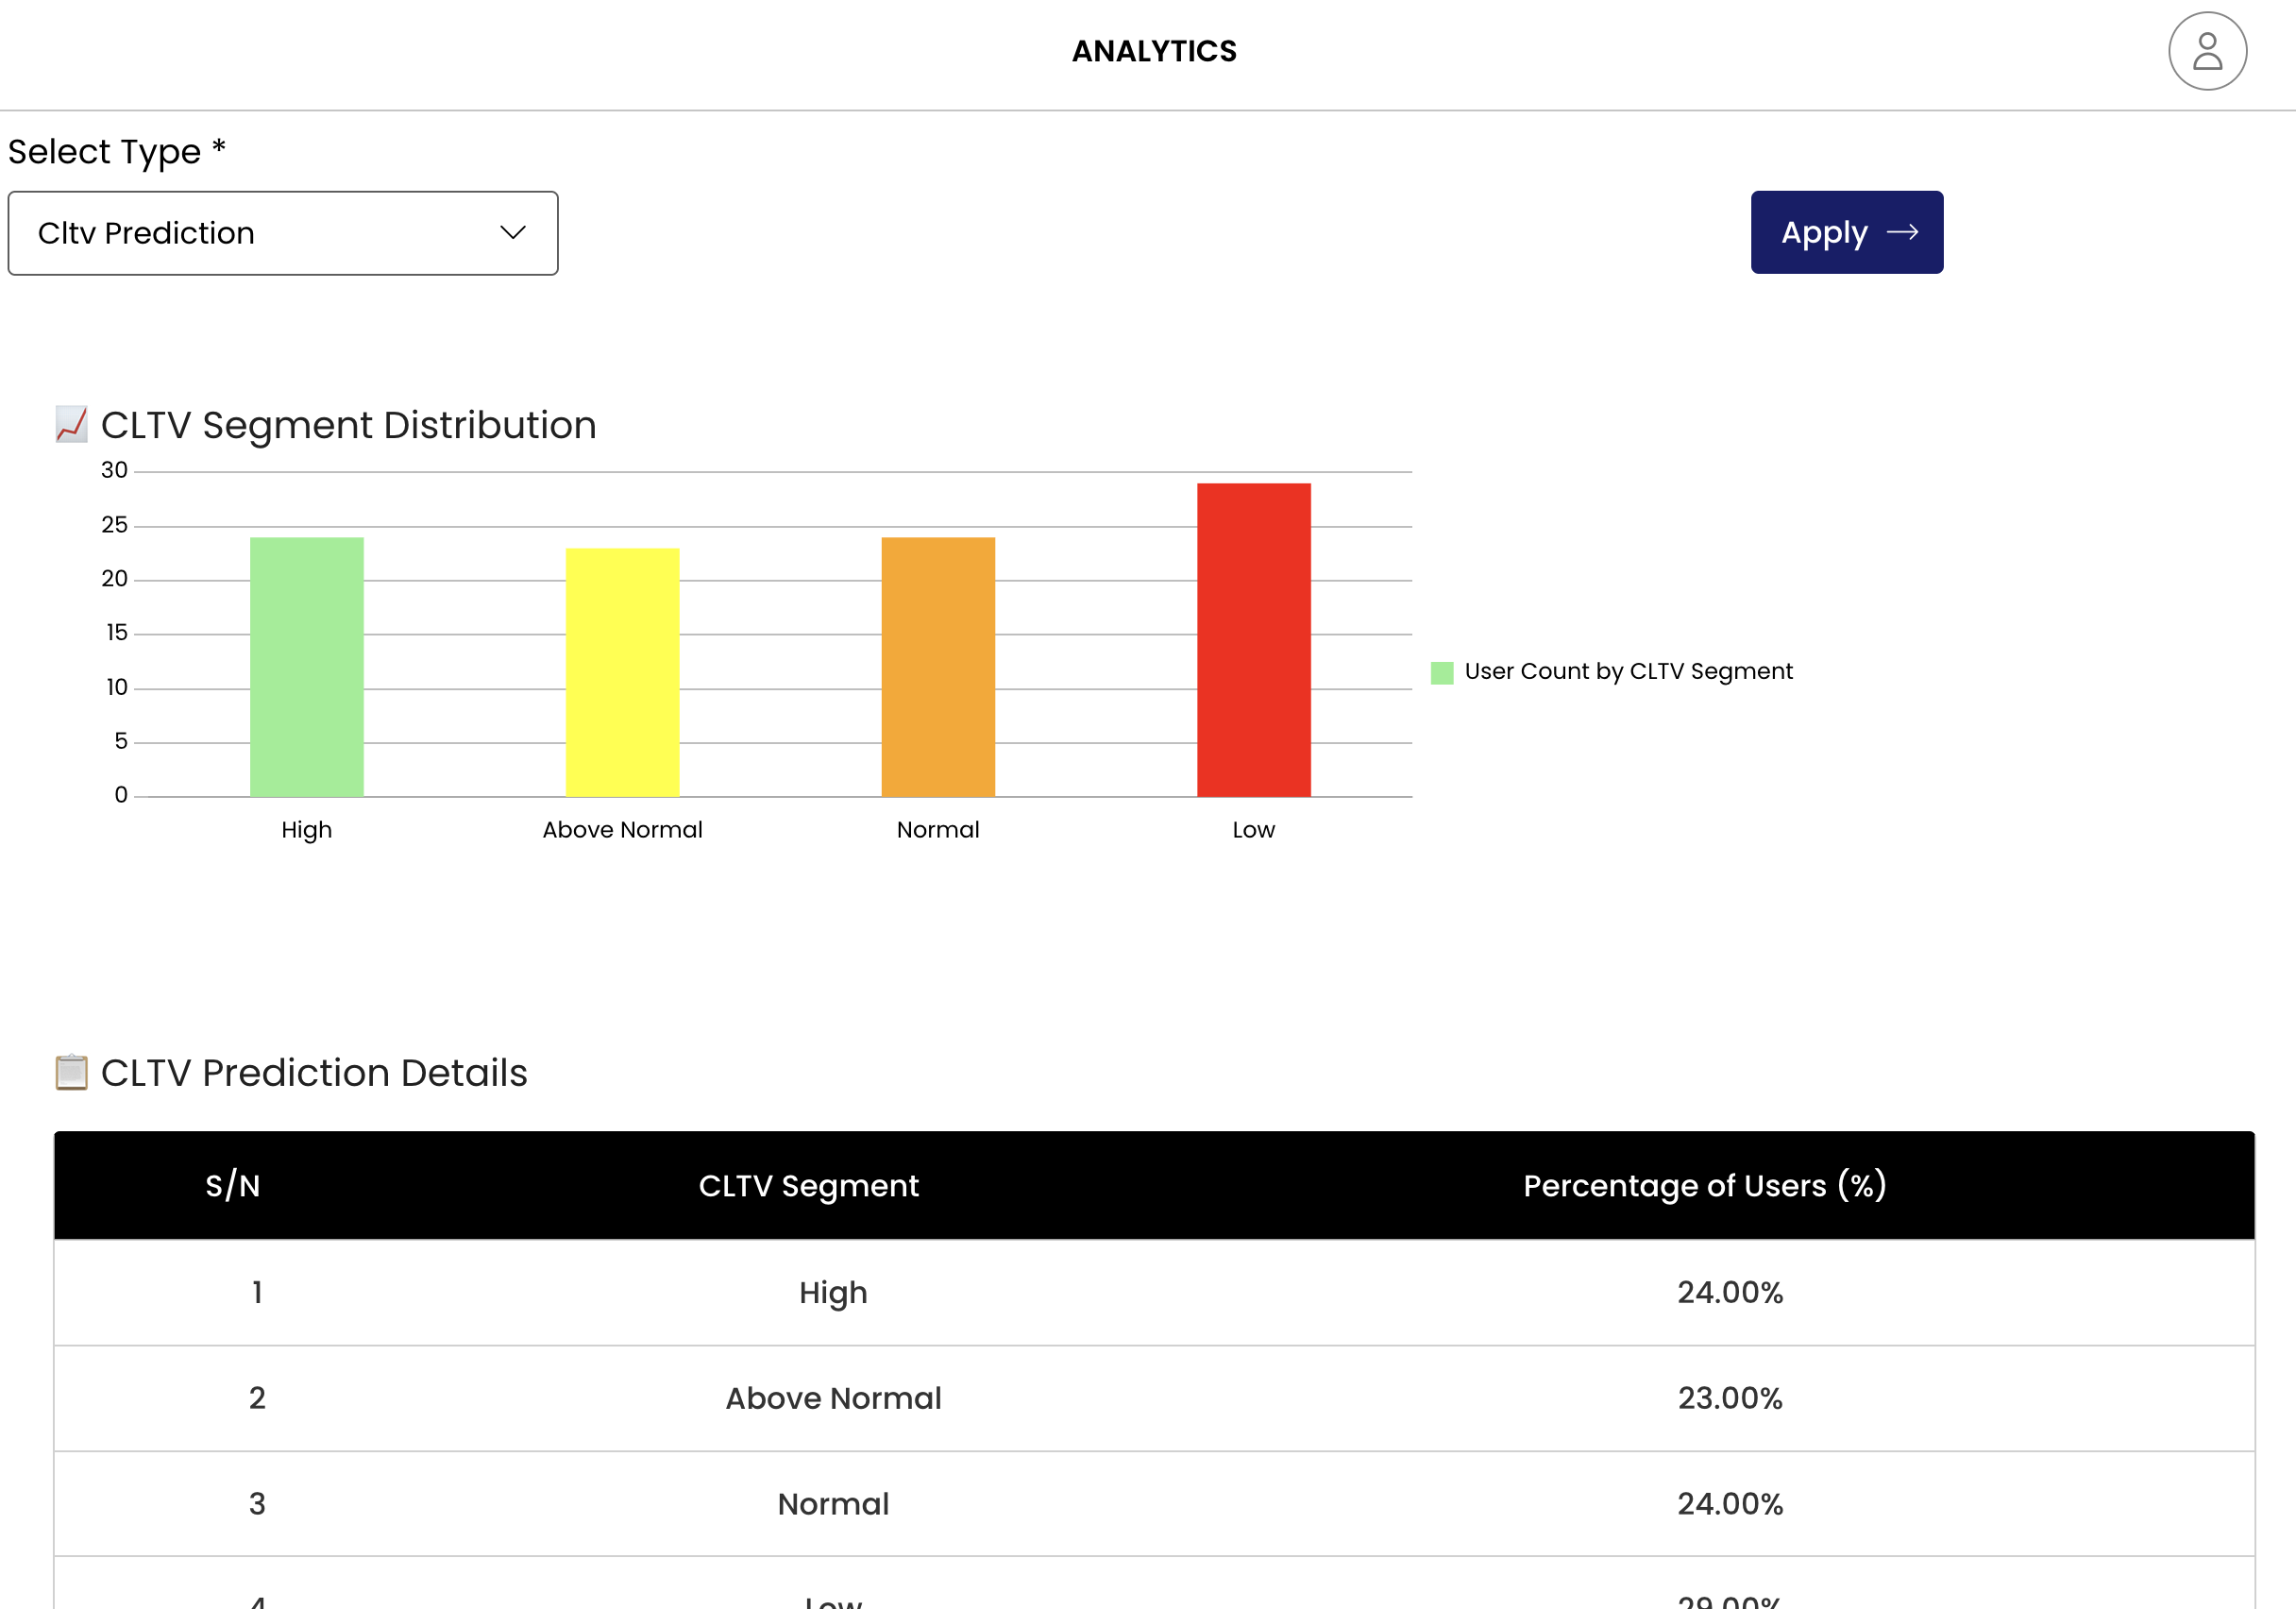
CLTV Segment Distribution Chart
- Chart Type: Bar chart visualization
- Y-Axis: User count
- X-Axis: CLTV segments (High, Above Normal, Normal, Low)
- Visual Elements: Color-coded bars representing each segment
- Purpose: Quick visual overview of customer distribution across CLTV segments
CLTV Prediction Details Table
- Format: Structured data table with the following columns:
- CLTV Segment: Segment classification
- Percentage of Users (%): Exact percentage distribution
- Sorting: Organized by segment hierarchy
- Data Precision: Percentages shown to two decimal places
Key Insights from Sample Data
Based on the analytics screen below:
- Balanced Distribution: The CLTV segments show relatively balanced distribution
- Low Segment Dominance: The “Low” CLTV segment indicating potential for optimization strategies
- High-Value Opportunity: Customers falling into “High” and “Above Normal” categories, representing significant revenue potential
- Strategic Segmentation: Nearly equal distribution allows for targeted campaign strategies across all segments
Business Applications
Marketing Strategy
- High CLTV: Premium product offerings, exclusive deals, personalized service
- Above Normal CLTV: Upselling campaigns, loyalty program enrollment
- Normal CLTV: Regular promotional campaigns, engagement maintenance
- Low CLTV: Cost-effective digital campaigns, retention analysis
Resource Allocation
- Customer Service: Prioritize high CLTV customers for premium support
- Marketing Budget: Allocate higher spending to high and above-normal segments
- Product Development: Focus on features that appeal to high-value segments
Performance Monitoring
- Track segment migration over time
- Monitor the effectiveness of segment-specific campaigns
- Analyze ROI by CLTV segment
Technical Specifications
Data Processing
- Prediction Model: Machine learning-based CLTV calculation
- Update Frequency: Real-time or scheduled batch processing
- Data Sources: Transaction history, engagement metrics, demographic data
Visualization Features
- Interactive bar charts with hover details
- Exportable data tables
- Color-coded segment identification
- Responsive design for different screen sizes
Integration Capabilities
- Campaign Management: Direct integration with campaign tools
- Customer Profiles: Link to detailed customer information
- Reporting: Export capabilities for external analysis
Best Practices
Implementation
- Data Quality: Ensure clean, comprehensive customer data for accurate predictions
- Regular Updates: Refresh CLTV predictions based on new transaction data
- Segment Validation: Periodically validate prediction accuracy against actual outcomes
- Cross-functional Alignment: Share insights with sales, marketing, and customer service teams
Optimization
- Threshold Adjustment: Fine-tune segment boundaries based on business objectives
- Feature Engineering: Incorporate additional data points for improved prediction accuracy
- A/B Testing: Test different strategies for each CLTV segment
- Feedback Loop: Use campaign results to refine prediction models
Troubleshooting
Common Issues
- Data Latency: Check data pipeline for processing delays
- Segment Imbalance: Review model parameters if distribution seems skewed
- Prediction Accuracy: Validate against historical data and adjust model weights
Reporting and Analytics
Standard Reports
- CLTV segment distribution over time
- Revenue contribution by segment
- Campaign performance by CLTV category
- Customer migration between segments
Custom Analytics
- Segment-specific conversion rates
- Lifetime value prediction accuracy
- ROI analysis by customer segment
- Churn prediction correlation with CLTV