Exploratory Data Analysis (EDA) in FirstHive Insights
The Exploratory Data Analysis (EDA) feature in FirstHive Insights enables you to perform comprehensive data exploration and analysis on your customer data. This powerful tool allows you to examine relationships between different customer attributes, identify patterns, and gain valuable insights from your unified customer profiles.
Key Features
Available Data Dimensions
The EDA functionality provides access to multiple customer data dimensions:
- AGE - Customer age demographics
- PLACE OF BIRTH - Geographic birth location data
- COUNTRY OF BIRTH - Country-level birth information
- GENDER CODE - Gender classification
- PAN ID GROUP - Tax identification groupings
- TAX STATUS - Tax filing status categories
- OCCUPATION GROUP - Professional/employment categories
- INCOME RANGE - Income bracket classifications
Analysis Options
Single Dimension Analysis
- Select one dimension from the “Select Options” dropdown
- View detailed breakdowns and distributions
- Analyze user counts across different categories
Multi-Dimensional Analysis
- Compare relationships between two variables
- Create cross-tabulation views
- Generate comparative visualizations
Accessing EDA
Perform the following steps to access exploratory data analysis:
- Log into the FirstHive platform and navigate to Analytics section on the left menu
- Choose Exploratory Data Analysis from the Select Type dropdown. This enables access to all available data dimensions.
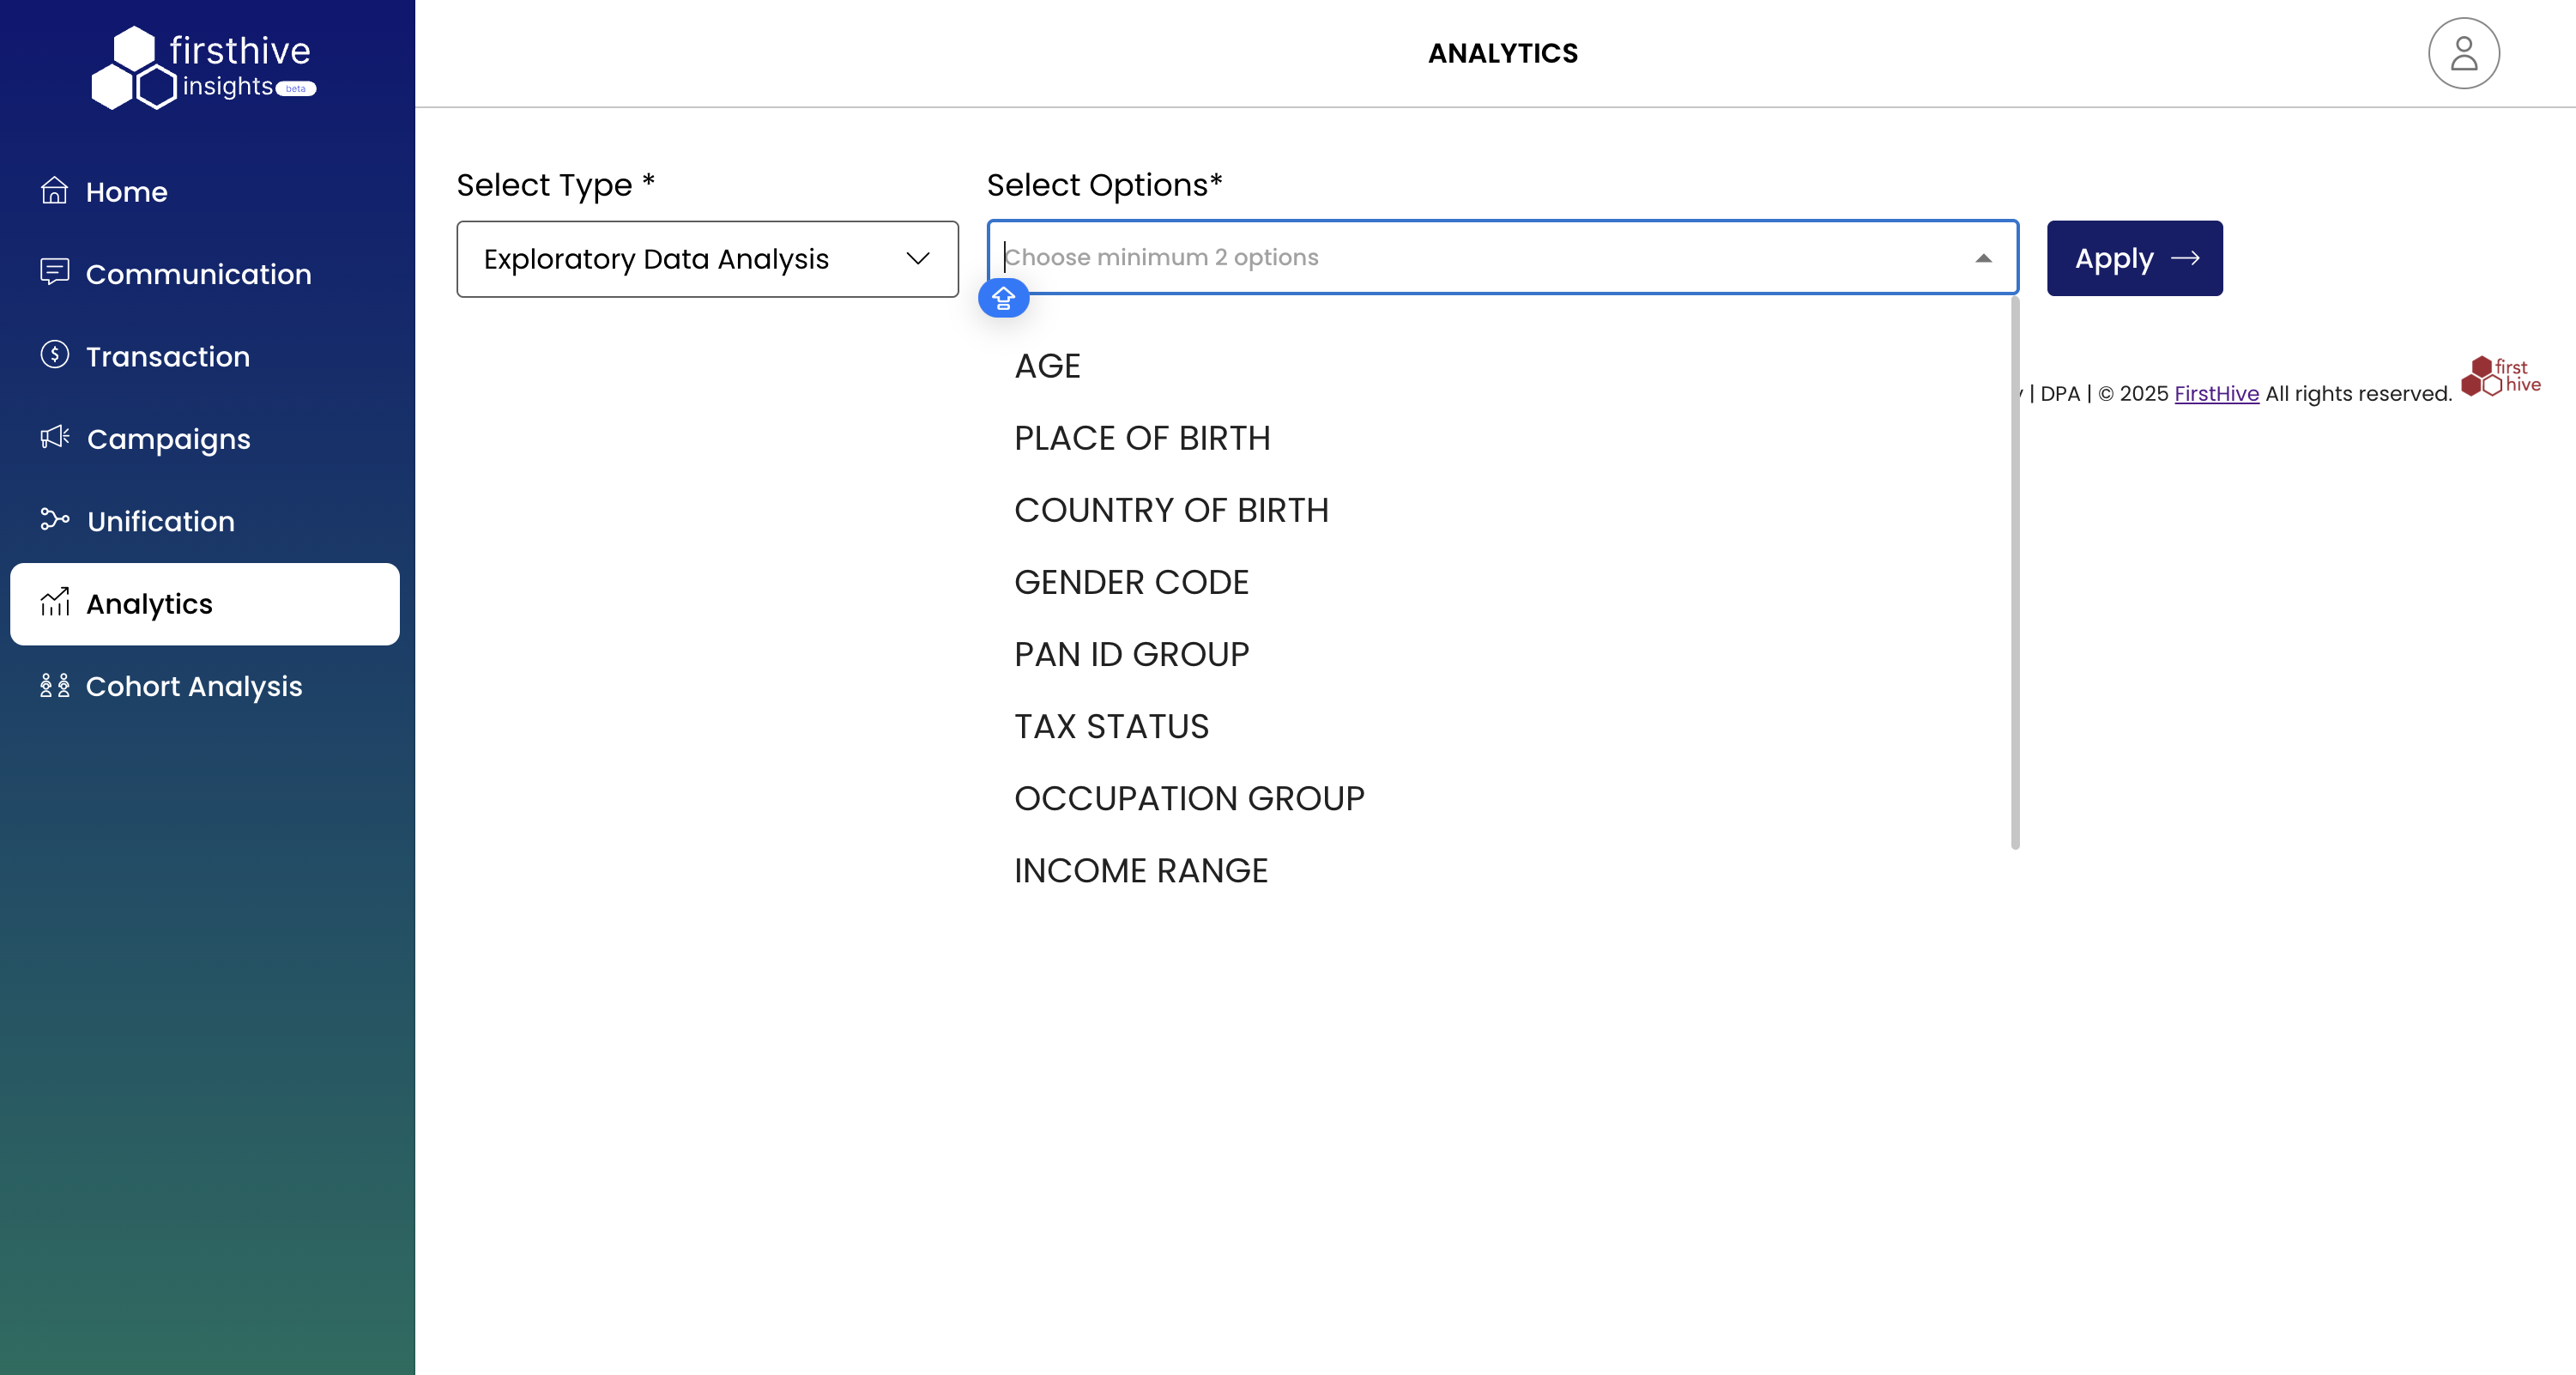
- From the Select Options dropdown, choose at least two options.
- Select the dimensions you want to analyze. Available options are displayed in the dropdown menu.
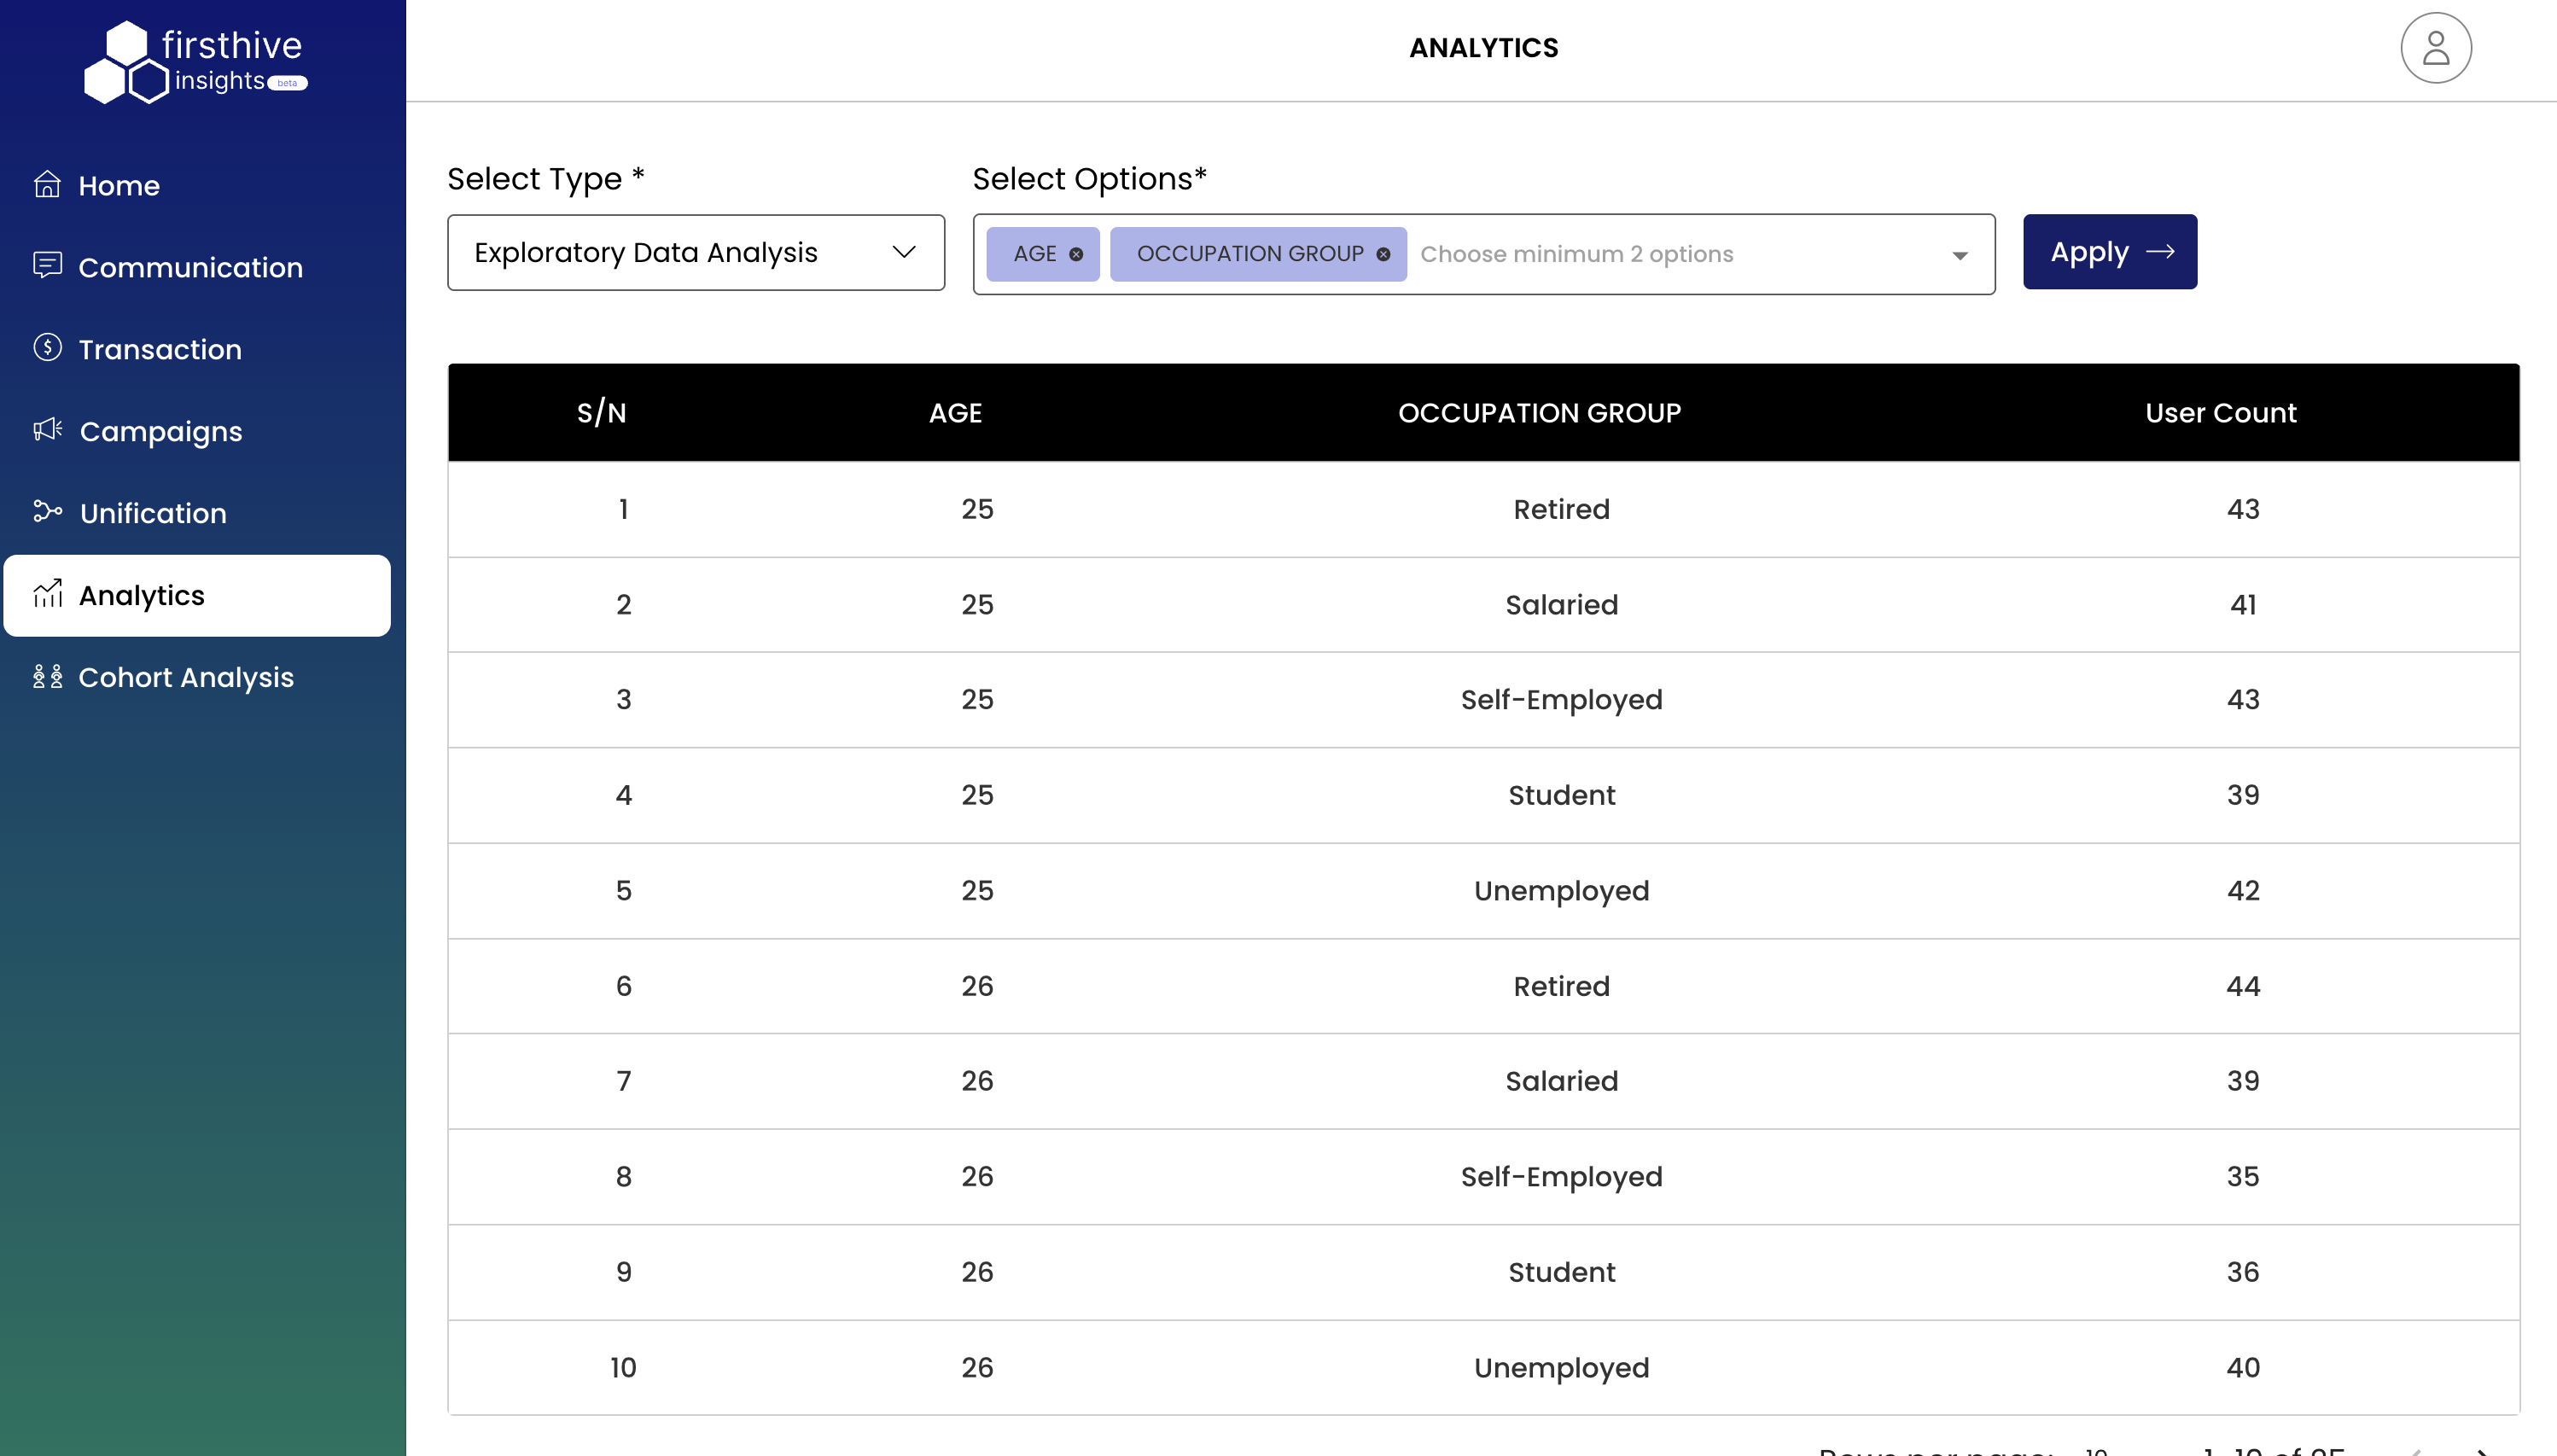
- Click Apply to execute your analysis. The system processes your selections and generates the result.
The results are displayed in multiple formats:
Tabular View
- S/N: Sequential row numbers
- Dimension columns: Show the selected attributes (e.g., AGE, OCCUPATION GROUP)
- User Count: Number of customers matching each combination
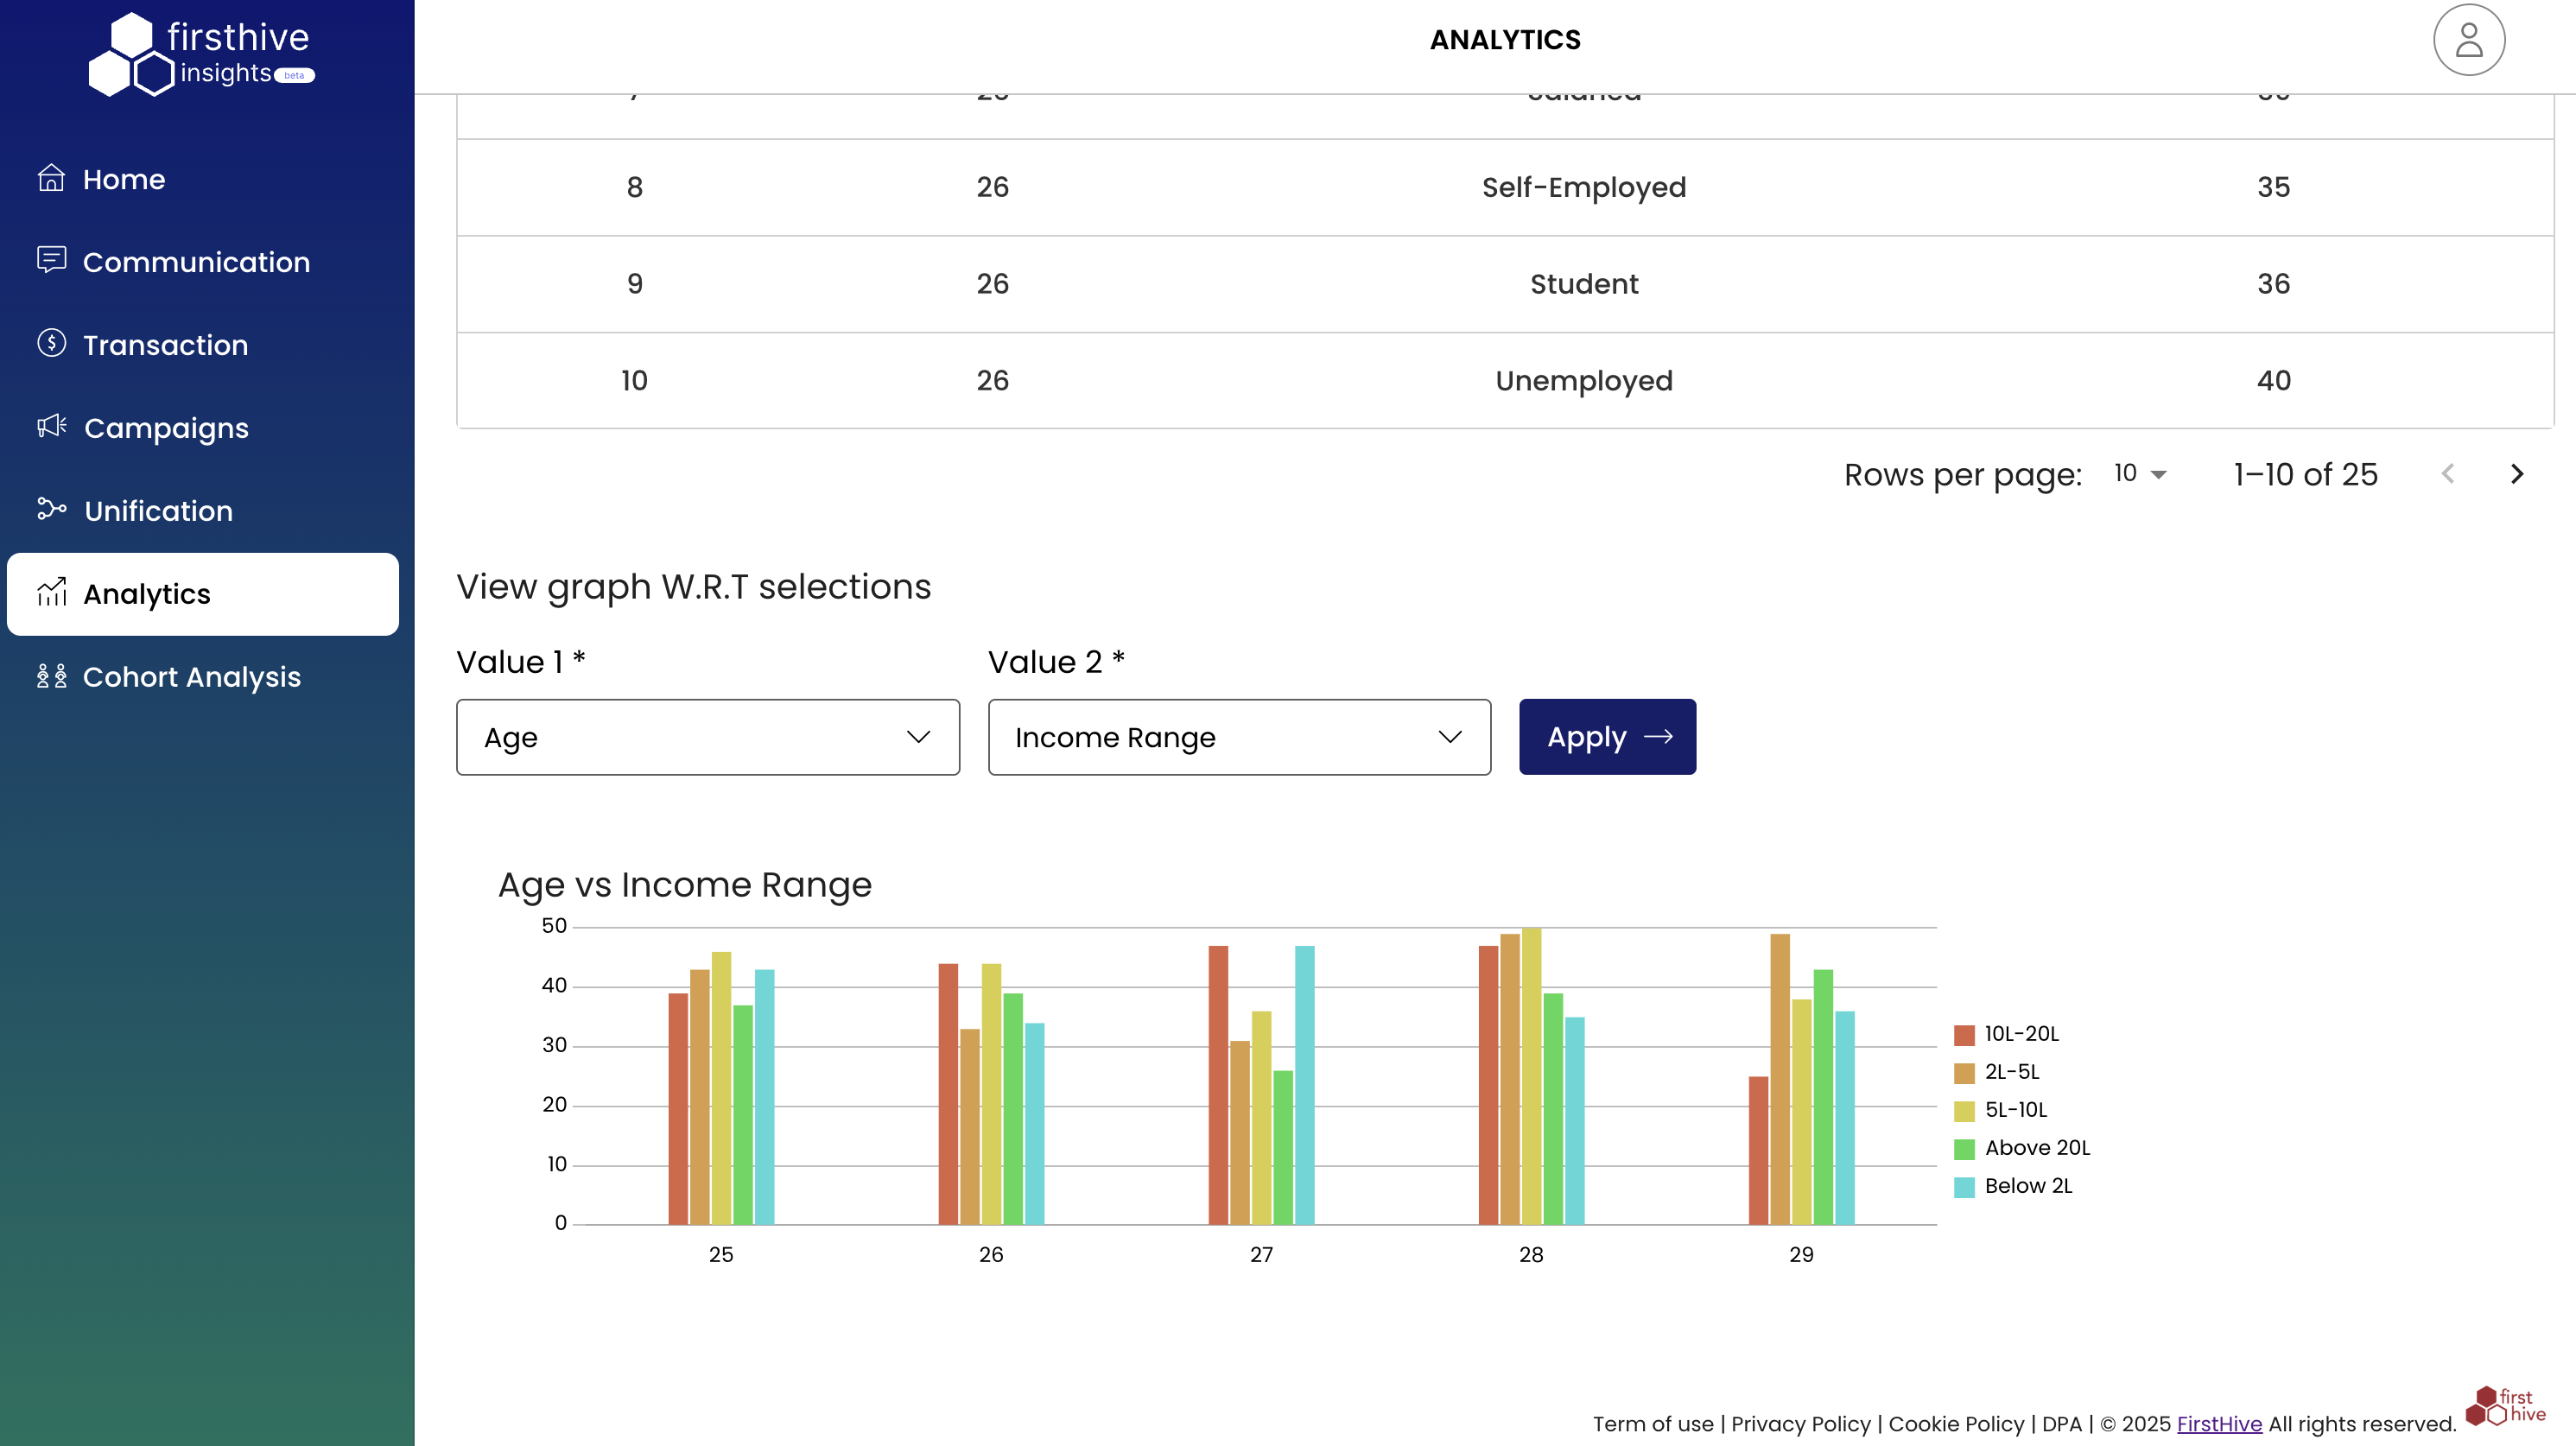
Visual Analysis
- Interactive charts and graphs
- Bar charts showing comparative distributions
- Color-coded visualizations for easy interpretation
Understanding EDA through Use Cases
The EDA feature lets you uncover insights, spot patterns, and understand relationships within your customer data. Use these practical approaches to make the most of your analysis.
Age vs Occupation Analysis
Discover how age groups relate to different professions:
- Identify which age groups are most represented in specific occupations
- Understand employment patterns across age demographics
- Pinpoint target audiences for campaigns
Income vs Demographics
Examine income patterns to guide strategic decisions:
- Analyze income by age to assess earning potential at different life stages
- Identify high-value regions through geographic income distribution
- Validate income assumptions across occupations
Multi-Variable Segmentation
Combine multiple attributes to create precise customer segments:
- Age + Income Range + Occupation
- Geographic + Income + Tax Status
- Any other combination of available dimensions
Data Interpretation
Understanding User Counts
- User Count represents the number of unique customer profiles matching your specified criteria
- Higher counts indicate larger customer segments
- Use counts to size target audiences and market opportunities
Pattern Recognition
- Look for unexpected combinations or gaps in data
- Identify over-represented or under-represented segments
- Detect trends across different demographic combinations
Best Practices
Selecting Dimensions
- Start Simple: Use 2–3 dimensions initially to keep results manageable
- Business Relevance: Choose dimensions that align with your marketing or business objectives
- Data Quality: Ensure coverage in your selected dimensions
Analysis Approach
- Hypothesis-Driven: Begin with clear questions you want to answer
- Iterative: Refine your analysis based on initial findings
- Comparative: Use multiple dimension combinations to validate insights
Result Validation
- Cross-Reference: Compare findings with known business metrics
- Sample Size: Ensure adequate user counts for statistical significance
- Time Relevance: Consider data freshness and seasonal variations
Technical Considerations
Data Requirements
- Select at least 2 options for meaningful analysis
- Ensure dimensions have sufficient customer records
- Use unified customer profiles for accurate cross-dimensional analysis
Performance
- Complex analyses may take longer to process
- Large datasets may require pagination for display
- Real-time updates depend on your CDP configuration
Troubleshooting
Common Issues
- No Results: Check if selected dimensions have overlapping data
- Low User Counts: Consider broader dimension categories or different combinations
- Loading Issues: Verify data synchronization and try refreshing the analysis
Note: For additional assistance with EDA functionality, contact FirstHive support or consult your customer success manager.