Transaction Summary
Transaction Summary in FirstHive CDP provides comprehensive insights into your business transaction data, enabling you to analyze revenue performance, product metrics, and customer purchasing patterns. This powerful analytics module helps businesses track transaction volumes, identify top-performing products, and make data-driven decisions to optimize revenue streams.
What is Transaction Summary?
Transaction Summary is a centralized analytics dashboard that consolidates all transaction data from your business operations. It provides detailed views of product performance, transaction types, revenue trends, and customer purchasing behavior, allowing you to monitor business health and identify growth opportunities in real-time.
Accessing Transaction Summary
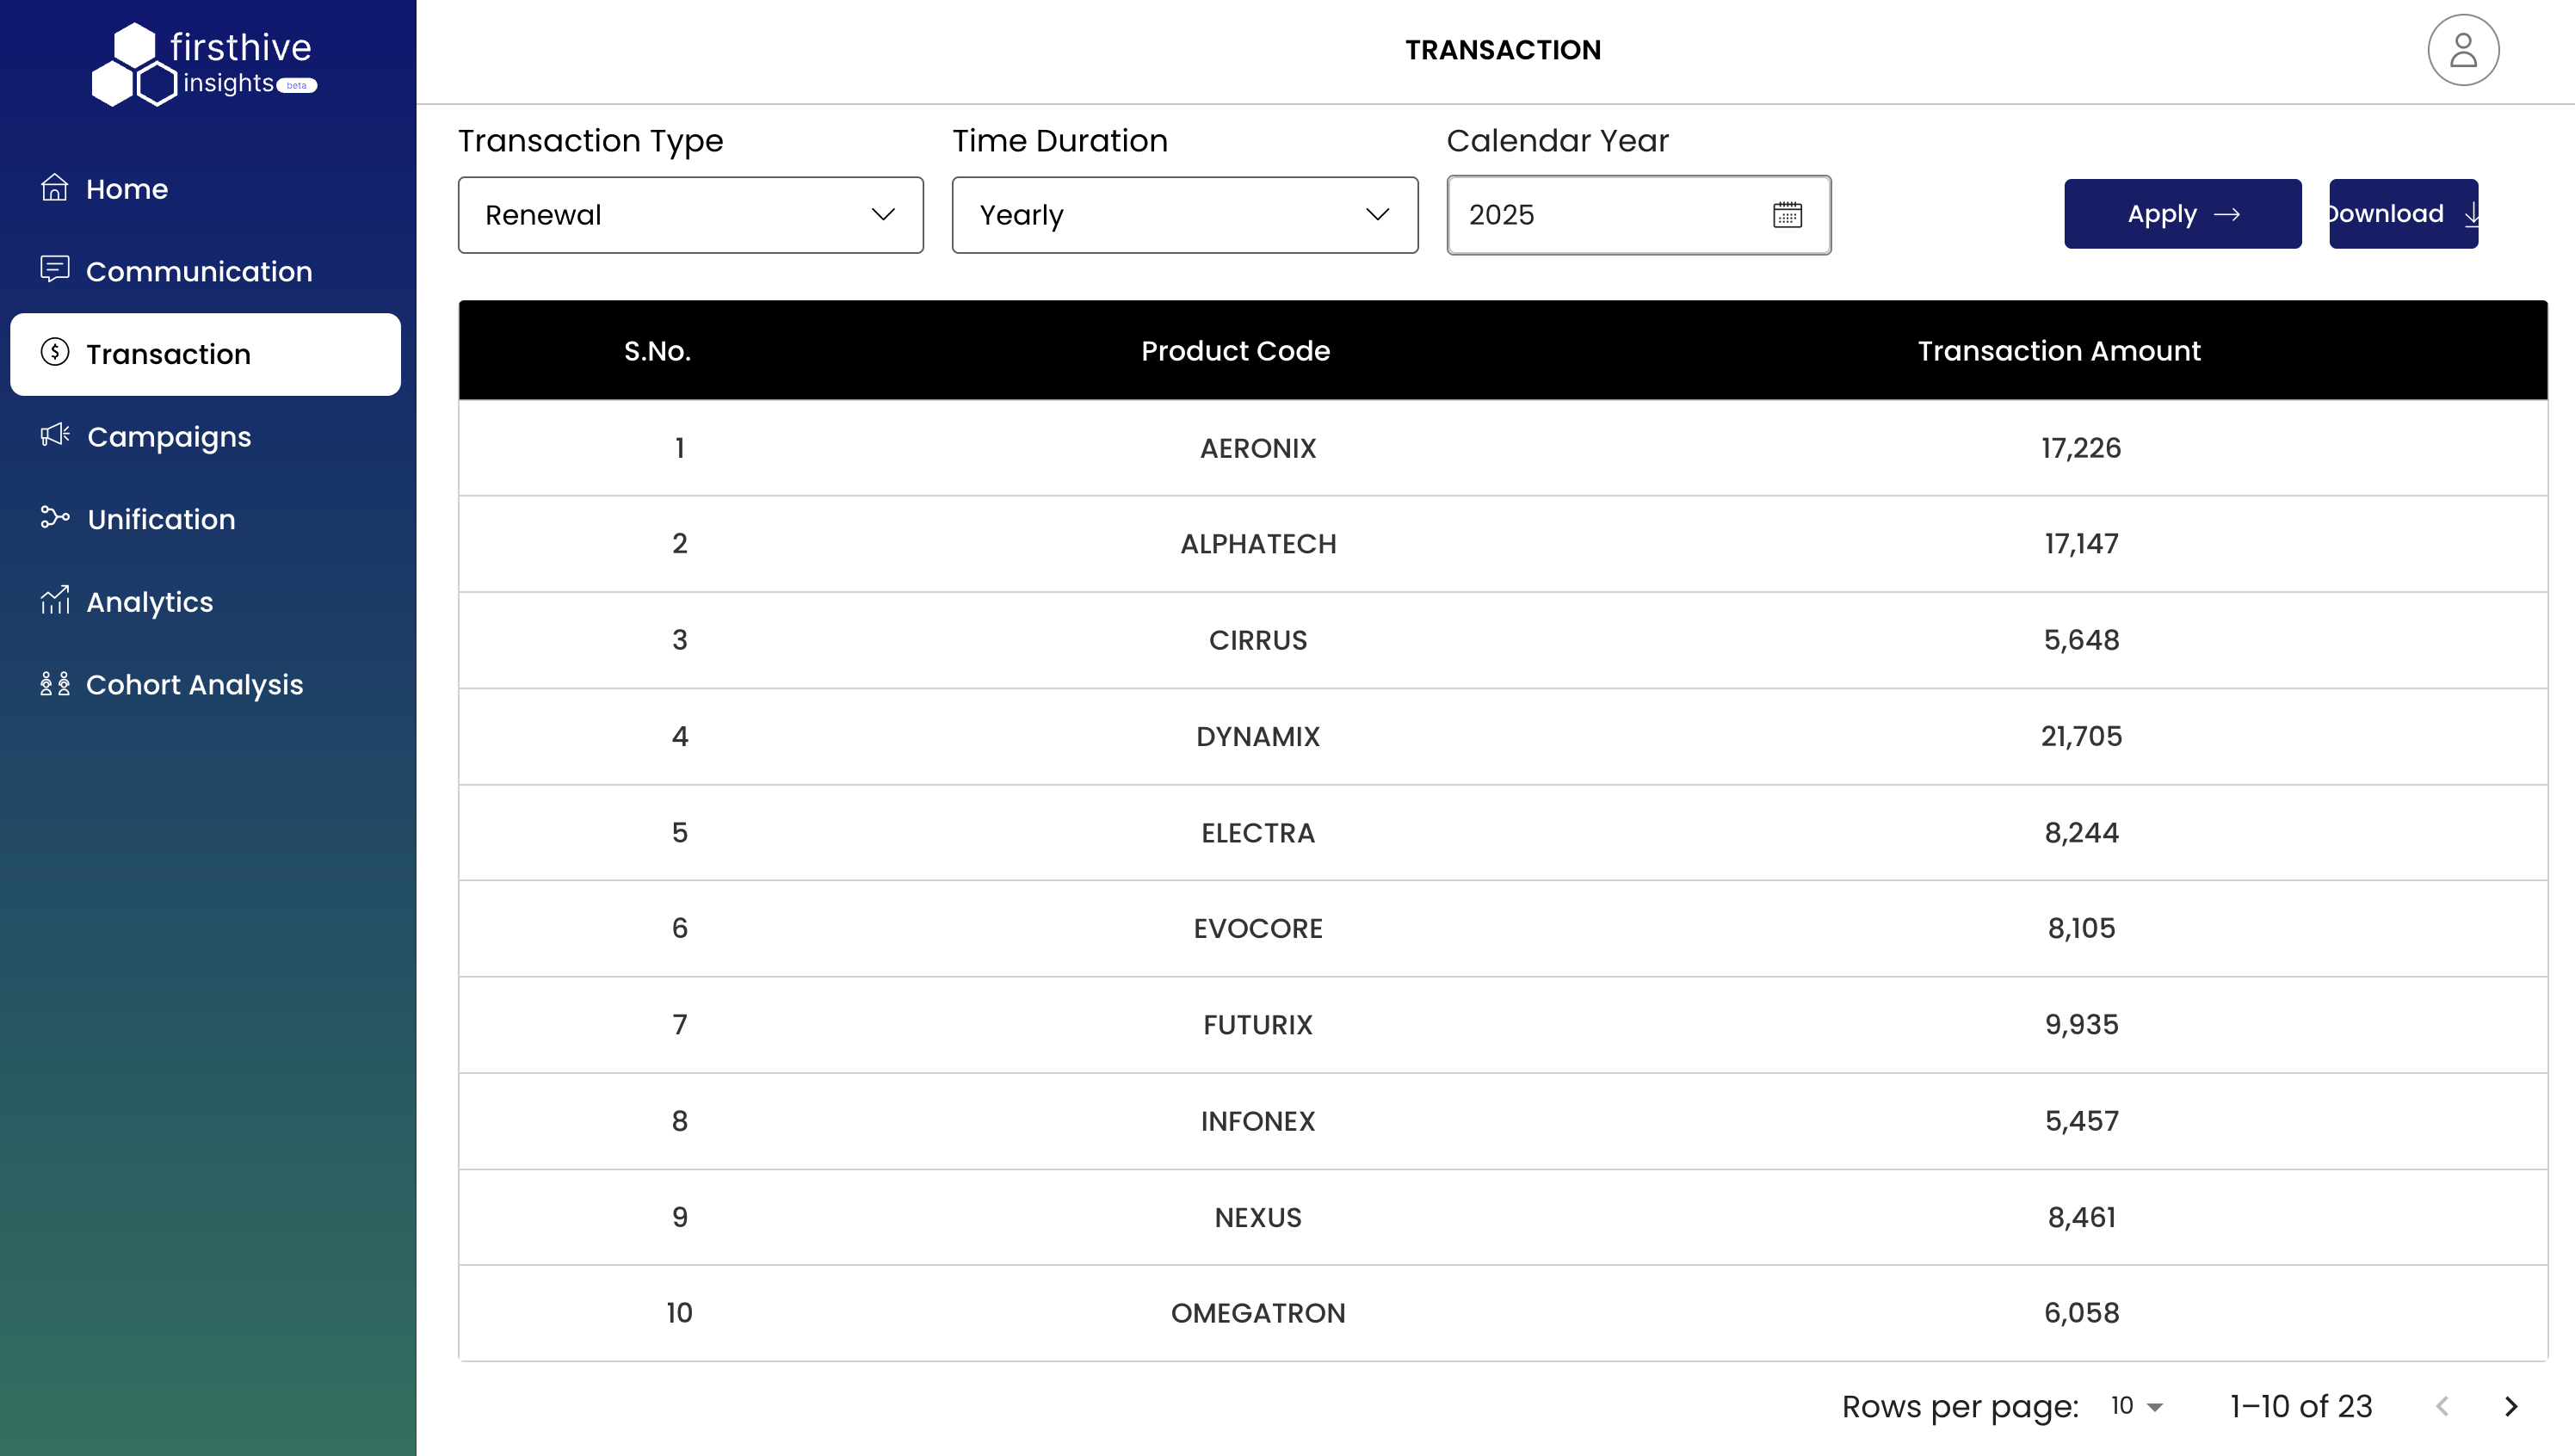
- Log into your FirstHive dashboard and click Transaction on the left menu. The Transaction Summary dashboard displays your transaction analytics.
- Use the filtering options to customize your data view.
- Apply filters and click Apply to refresh the data.
Key Features and Components
Filter Controls
The Transaction Summary includes powerful filtering capabilities to help you analyze specific data segments:
Transaction Type Filter
- Purpose: Filter transactions by specific business transaction categories
- Available Options:
- Registration
- Renewal
- Cat (Category-based transactions)
- Use Case: Analyze performance of different transaction types separately
Time Duration Filter
- Purpose: Set the time period for transaction analysis
- Available Options:
- Yearly
- Monthly
- Quarterly
- Custom date ranges
- Default Selection: Yearly
- Use Case: Compare performance across different time periods
Calendar Year Filter
- Purpose: Select specific calendar year for analysis
- Functionality: Date picker interface for easy year selection
- Use Case: Year-over-year performance comparison
Data Table Components
Product Performance Table
The main data table displays detailed transaction information with the following columns:
Product Code Column
- Purpose: Unique identifier for each product or service
- Sorting: Sortable for easy product identification
- Use Case: Quick product lookup and performance tracking
Transaction Amount Column
- Purpose: Total transaction value for each product
- Format: Numerical values representing revenue amounts
- Currency: Based on your business currency settings
- Use Case: Revenue analysis and product profitability assessment
Pagination and Display Controls
Rows Per Page
- Options: Customizable display (showing 10 rows per page in example)
- Functionality: Dropdown selector for different page sizes
- Range: Typically 10, 25, 50, 100 rows per page
- Use Case: Optimize data viewing based on screen size and preference
Understanding Transaction Data
Sample Product Performance Analysis
Based on the displayed data, here’s how to interpret the transaction summary:
Top Performing Products (by Transaction Amount)
- DYNAMIX: 21,705 (Highest revenue generator)
- AERONIX: 17,226 (Strong second position)
- ALPHATECH: 17,147 (Close third position)
Mid-Range Performers
- FUTURIX: 9,935
- NEXUS: 8,461
- ELECTRA: 8,244
Lower Volume Products
- EVOCORE: 8,105
- OMEGATRON: 6,058
- CIRRUS: 5,648
- INFONEX: 5,457
Key Insights from Sample Data
Revenue Distribution
- Total Visible Revenue: 115,827 across 10 products shown
- Average Transaction Value: 11,583 per product
- Revenue Concentration: Top 3 products account for 48.7% of visible revenue
- Performance Spread: 4x difference between highest and lowest performers
Product Portfolio Analysis
- High Performers: 3 products generating 15,000+ in transactions
- Mid Performers: 4 products in the 8,000-10,000 range
- Lower Performers: 3 products below 8,000 in transactions
- Portfolio Balance: Relatively balanced distribution across performance tiers
Transaction Types Explained
Registration Transactions
- Definition: Initial customer onboarding and account setup transactions
- Characteristics: One-time payments, setup fees, initial purchases
- Analysis Focus: Customer acquisition costs, conversion rates, onboarding success
- Business Impact: Foundation for customer lifetime value calculations
Renewal Transactions
- Definition: Recurring payments from existing customers for service continuations
- Characteristics: Subscription renewals, contract extensions, repeat purchases
- Analysis Focus: Customer retention, recurring revenue, churn prevention
- Business Impact: Primary indicator of customer satisfaction and business sustainability
Category (Cat) Transactions
- Definition: Product or service category-specific transactions
- Characteristics: Varied transaction types grouped by business category
- Analysis Focus: Category performance, cross-selling opportunities, market segments
- Business Impact: Portfolio optimization and strategic planning insights
Using Transaction Summary for Business Intelligence
For Sales Teams
Performance Tracking
- Product Focus: Identify which products drive the most revenue
- Trend Analysis: Track performance changes over time periods
- Goal Setting: Use historical data to set realistic sales targets
- Territory Analysis: Compare product performance across different regions
Opportunity Identification
- Underperforming Products: Identify products needing sales support
- Growth Opportunities: Spot products with potential for expansion
- Cross-Selling: Identify complementary products for bundling strategies
- Customer Segments: Understand which products appeal to different customer types
For Marketing Teams
Campaign Planning
- Product Prioritization: Focus marketing efforts on high-value products
- Budget Allocation: Distribute marketing spend based on revenue potential
- Audience Targeting: Identify customer segments for specific products
- Content Strategy: Create content around top-performing products
Performance Measurement
- Campaign ROI: Measure marketing campaign impact on transaction volumes
- Product Positioning: Adjust messaging based on product performance data
- Seasonal Trends: Identify seasonal patterns in product demand
- Competitive Analysis: Benchmark product performance against market standards
For Finance Teams
Revenue Analysis
- Revenue Recognition: Track and categorize different revenue streams
- Financial Planning: Use transaction data for budget planning and forecasting
- Profitability Analysis: Combine transaction data with cost information
- Risk Assessment: Identify revenue concentration risks
Reporting and Compliance
- Financial Reporting: Generate accurate revenue reports for stakeholders
- Audit Preparation: Maintain detailed transaction records for audits
- Tax Compliance: Categorize transactions for proper tax reporting
- Investor Relations: Provide detailed revenue breakdowns to investors
For Product Teams
Product Performance
- Usage Analytics: Understand which products customers value most
- Feature Development: Prioritize development based on revenue impact
- Product Lifecycle: Track products through different lifecycle stages
- Sunset Decisions: Identify underperforming products for potential discontinuation
Market Insights
- Customer Preferences: Understand customer buying patterns
- Pricing Strategy: Analyze price sensitivity across different products
- Competitive Positioning: Position products based on market performance
- Innovation Opportunities: Identify gaps in product portfolio
Advanced Analytics and Insights
Time-Series Analysis
Yearly Analysis
- Annual Trends: Identify long-term growth or decline patterns
- Year-over-Year Comparison: Compare current year performance with previous years
- Seasonal Patterns: Identify seasonal fluctuations in transaction volumes
- Growth Rate Calculation: Calculate annual growth rates for strategic planning
Monthly and Quarterly Breakdowns
- Short-term Trends: Track month-to-month or quarter-to-quarter changes
- Performance Peaks: Identify peak performance periods
- Dip Analysis: Investigate periods of lower transaction volumes
- Forecasting: Use historical patterns to predict future performance
Comparative Analysis
Product Comparison
- Revenue Ranking: Rank products by transaction amounts
- Performance Ratios: Calculate performance ratios between products
- Market Share: Determine each product’s share of total revenue
- Growth Comparison: Compare growth rates across different products
Transaction Type Analysis
- Type Distribution: Analyze the mix of different transaction types
- Revenue Contribution: Understand how much each type contributes to total revenue
- Customer Behavior: Analyze customer preferences for different transaction types
- Business Model Insights: Optimize business model based on transaction patterns
Data Export and Reporting
Export Functionality
Download Options
- CSV Export: Raw data export for external analysis
- Excel Export: Formatted spreadsheets for detailed analysis
- API Access: Programmatic access to transaction data
Report Customization
- Date Range Selection: Export data for specific time periods
- Product Filtering: Export data for selected products only
- Transaction Type Filtering: Focus exports on specific transaction categories
- Custom Formatting: Choose specific columns and data formats
Best Practices for Transaction Analysis
Regular Monitoring
Daily Reviews
- Quick Performance Check: Daily review of top-performing products
- Anomaly Identification: Spot unusual transaction patterns quickly
- Real-time Adjustments: Make immediate adjustments based on daily data
- Customer Service: Use transaction data to address customer issues
Weekly Analysis
- Trend Identification: Identify weekly trends and patterns
- Performance Comparison: Compare week-over-week performance
- Strategic Adjustments: Make strategic adjustments based on weekly insights
- Team Reporting: Share weekly insights with relevant teams
Monthly Deep Dives
- Comprehensive Analysis: Detailed monthly performance analysis
- Strategic Planning: Use monthly data for strategic planning sessions
- Forecasting Updates: Update forecasts based on monthly performance
- Stakeholder Reporting: Prepare detailed reports for stakeholders
Troubleshooting Common Issues
Data Discrepancies
Missing Transactions
Potential Causes:
- System integration issues
- Data synchronization delays
- Incomplete data imports
Solutions:
- Check system integration status
- Verify data import procedures
- Contact technical support for sync issues
Incorrect Amounts
Potential Causes:
- Currency conversion errors
- Tax calculation issues
- Data entry mistakes
Solutions:
- Verify currency settings
- Check tax calculation rules
- Review data entry procedures
Performance Issues
Slow Loading Times
Potential Causes:
- Large dataset queries
- Network connectivity issues
- System performance limitations
Solutions:
- Use appropriate date ranges
- Check network connection
- Contact support for performance optimization
Filter Problems
Potential Causes:
- Browser cache issues
- Corrupted filter settings
- System configuration problems
Solutions:
- Clear browser cache
- Reset filter settings
- Verify system configuration